
Table 2.
Estimates of mutation rates (θ) and recombination rates (ρ) per base
Click on table to view larger version.
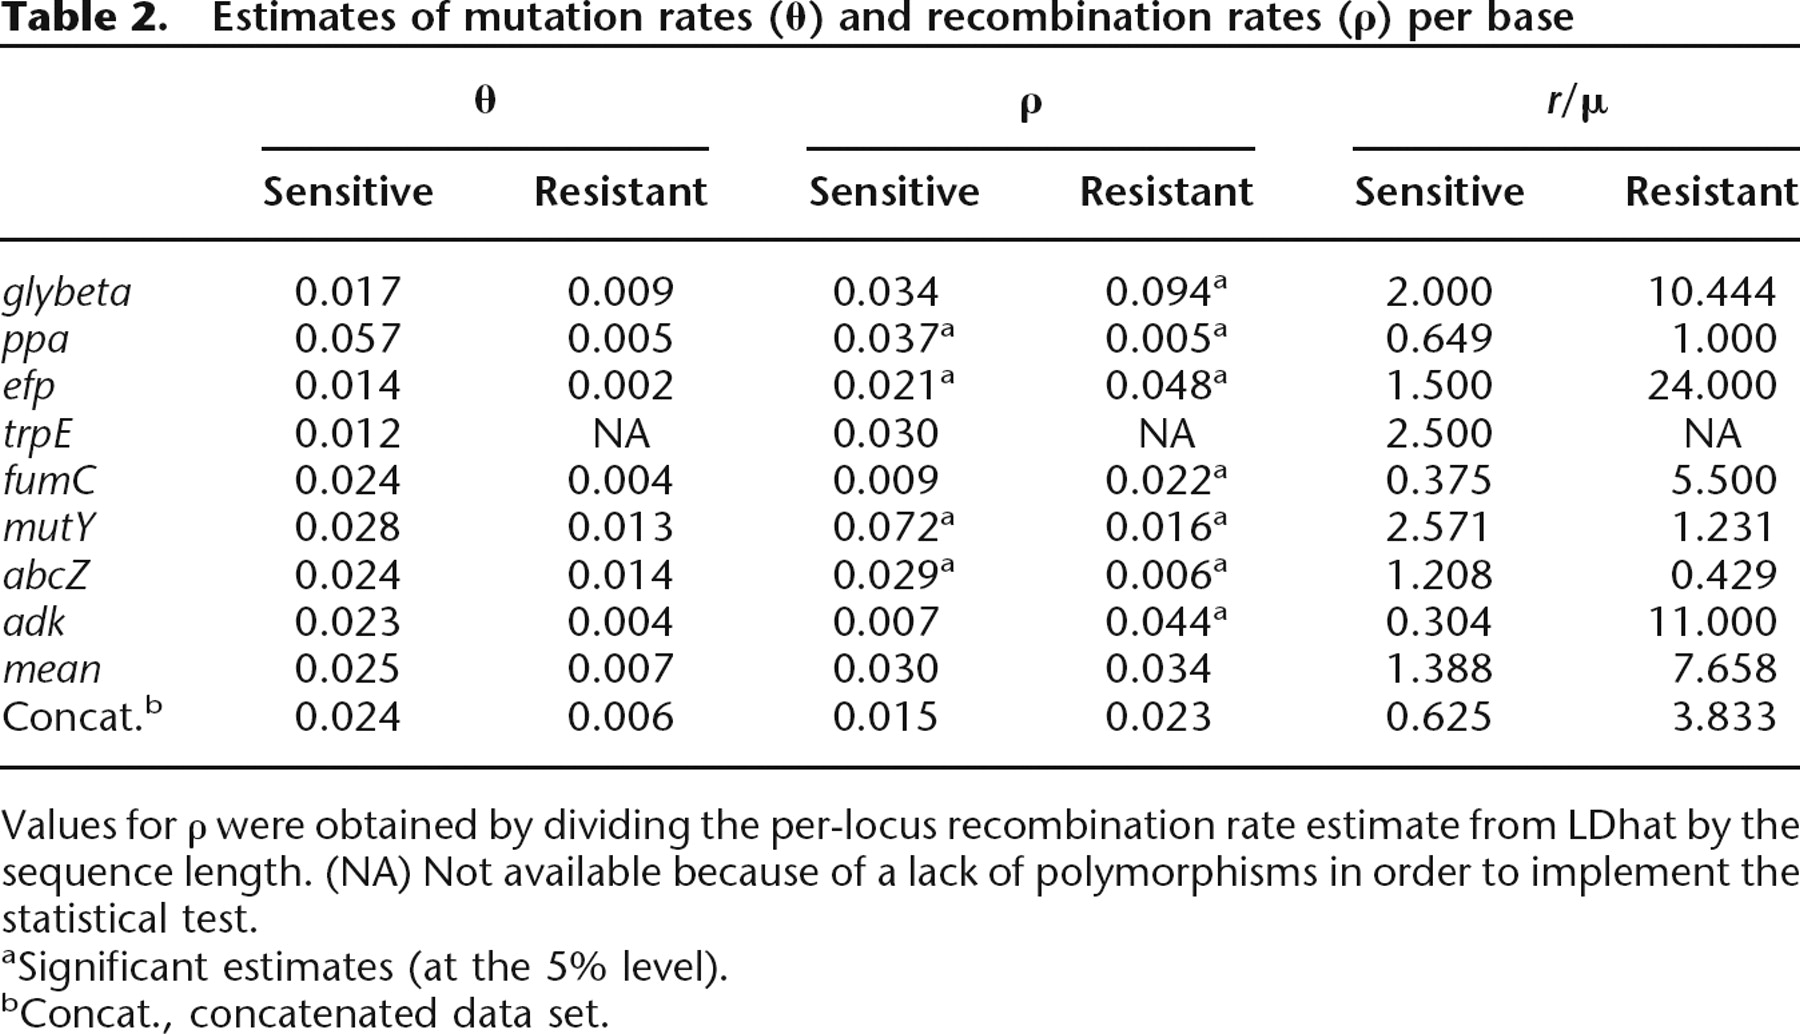
Values for ρ were obtained by dividing the per-locus recombination rate estimate from LDhat by the sequence length. (NA) Not available because of a lack of polymorphisms in order to implement the statistical test.
aSignificant estimates (at the 5% level).
bConcat., concatenated data set.


