
Table 1.
Population genetic analyses of the serosensitive (n = 42) and seroresistant (n = 222) populations
Click on table to view larger version.
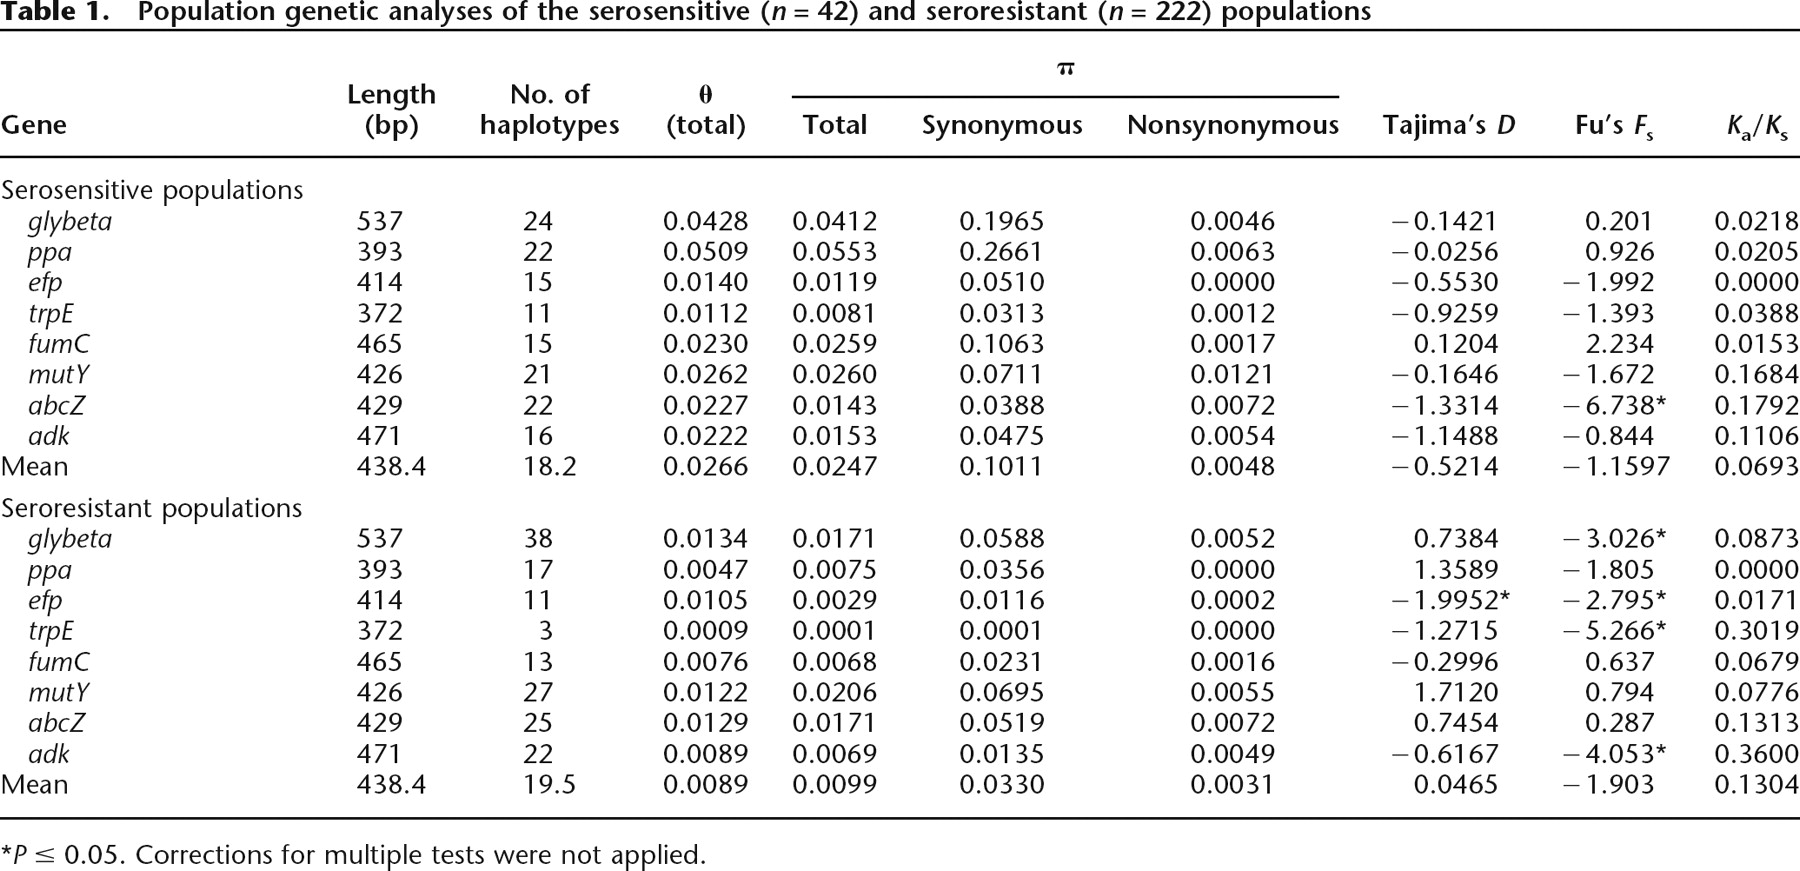
*P ≤ 0.05. Corrections for multiple tests were not applied.


