
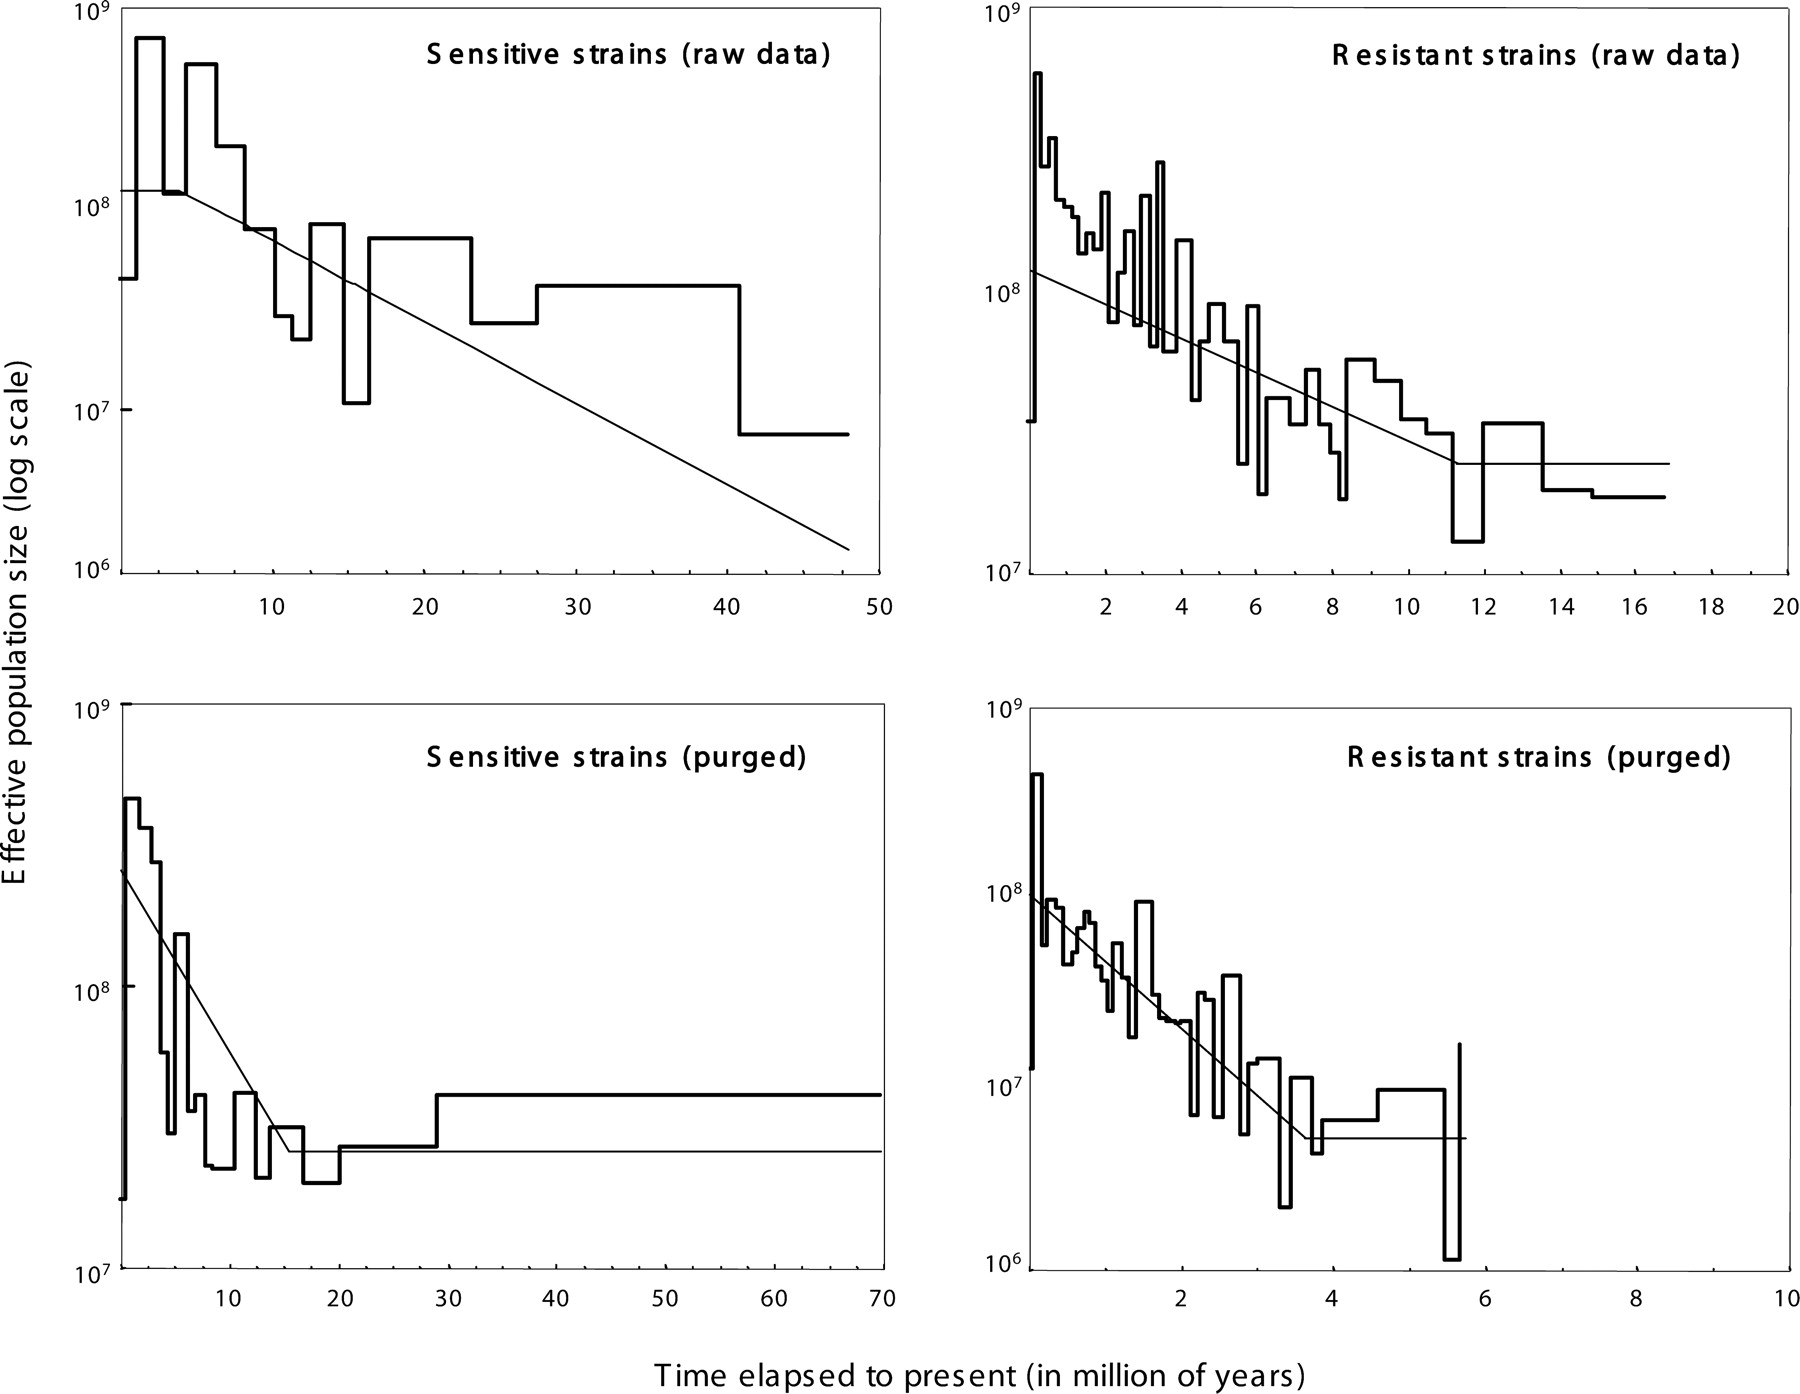
Figure 6.
Estimated demographic histories of the serosensitive and seroresistant M. catarrhalis populations based on the concatenated sequences. The thicker lines are the generalized skyline plots. The approximate timescale assumes a mutation rate (μ) of 7.6 × 10⁻¹⁰. The thinner, smooth curves represent the parametric ML demographic history (see Table 3).


