
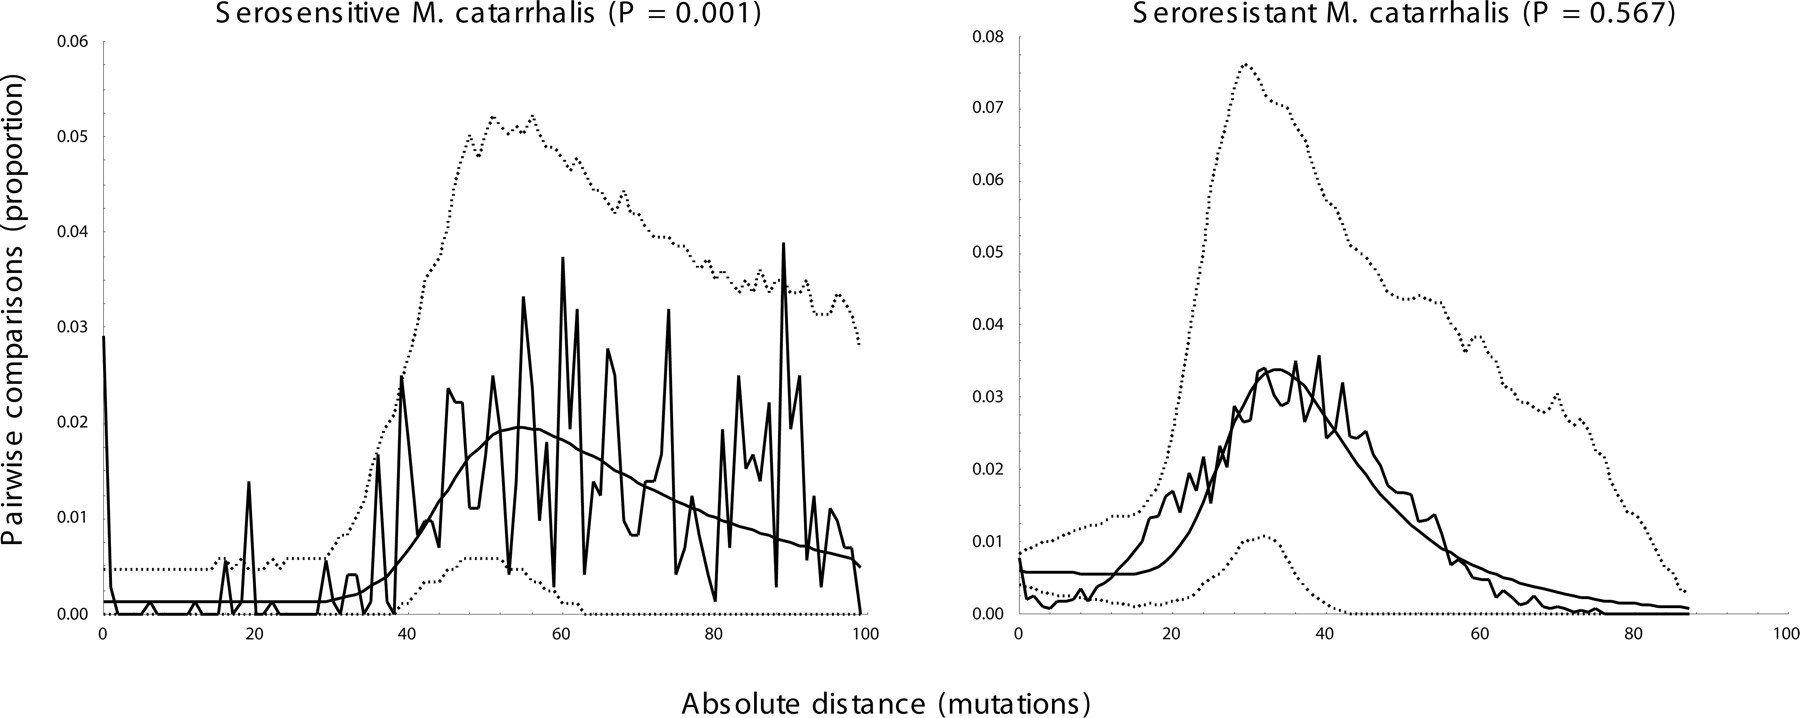
Figure 5.
Mismatch frequency distributions of pairwise differences between concatenated sequences within serosensitive and seroresistant M. catarrhalis populations. The jagged plots correspond to the observed data. The smooth curves correspond to the predictions of a sudden expansion model whose 95% confidence intervals are indicated by dashed lines. P-values represent the probability that the raggedness of the simulated data set is equal to or greater than the observed data set.


