
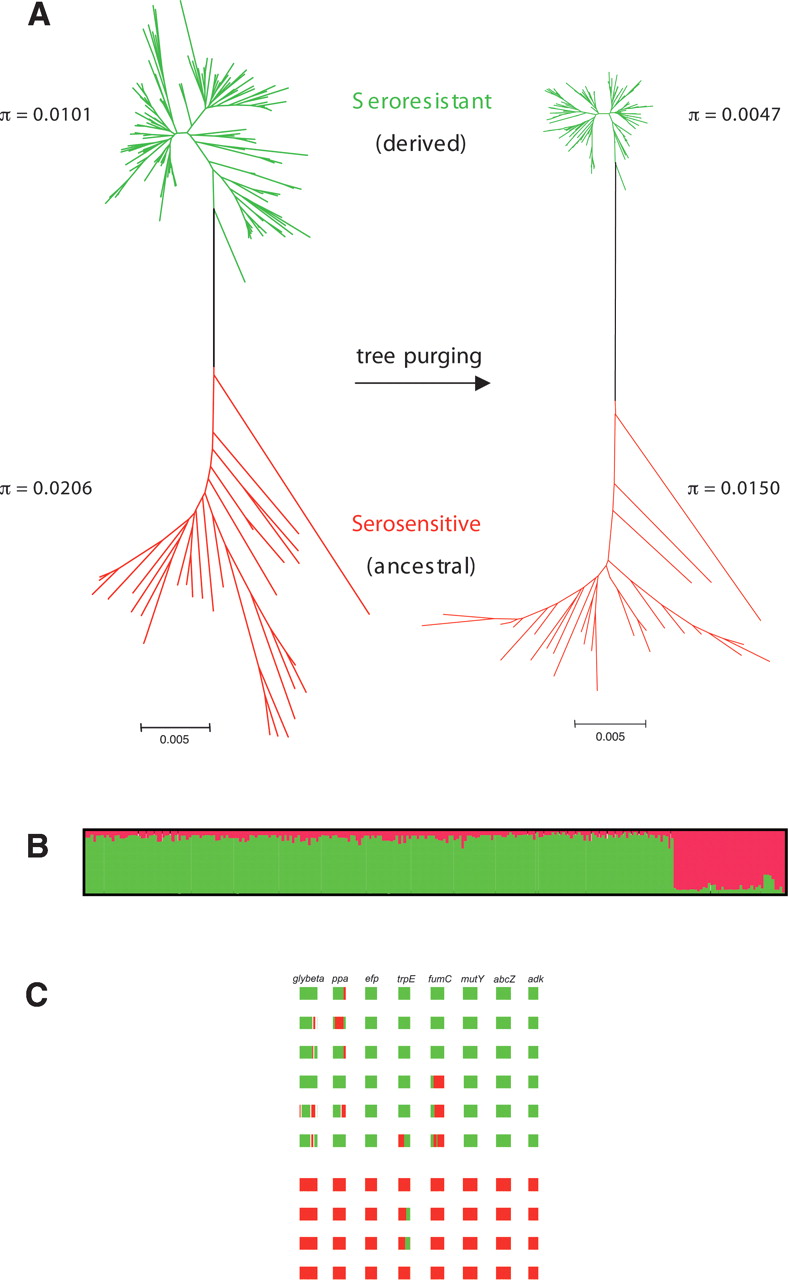
Phylogeny and ancestry of 264 M. catarrhalis isolates. (A) Unpurged (left) and purged (right) neighbor-joining trees of concatenated sequences using Tamura-Nei + G + I models. The bootstrap support for the two colored groups is 100%. Unpurged tree model: G = 0.412, I = 0.828; purged tree model: G = 0.353, I = 0.839. (B) Proportions of ancestry from two ancestral populations as inferred by the linkage model of STRUCTURE. This plot shows one vertical line for each isolate in which the proportions of ancestry from the two sources are color-coded. Only recombinations between the two populations can be detected. (C) Examples of recombination within 10 random strains belonging to the two main populations. Boxes colored as in A indicate sources of ancestry of stretches of nucleotides within each of the eight loci, shown in the order glybeta, ppa, efp, trpE, fumC, mutY, abcZ, and adk. Note that the serosensitive strains (bottom) are genetically rather homogeneous, whereas the seroresistant strains (top) are more admixed.


