
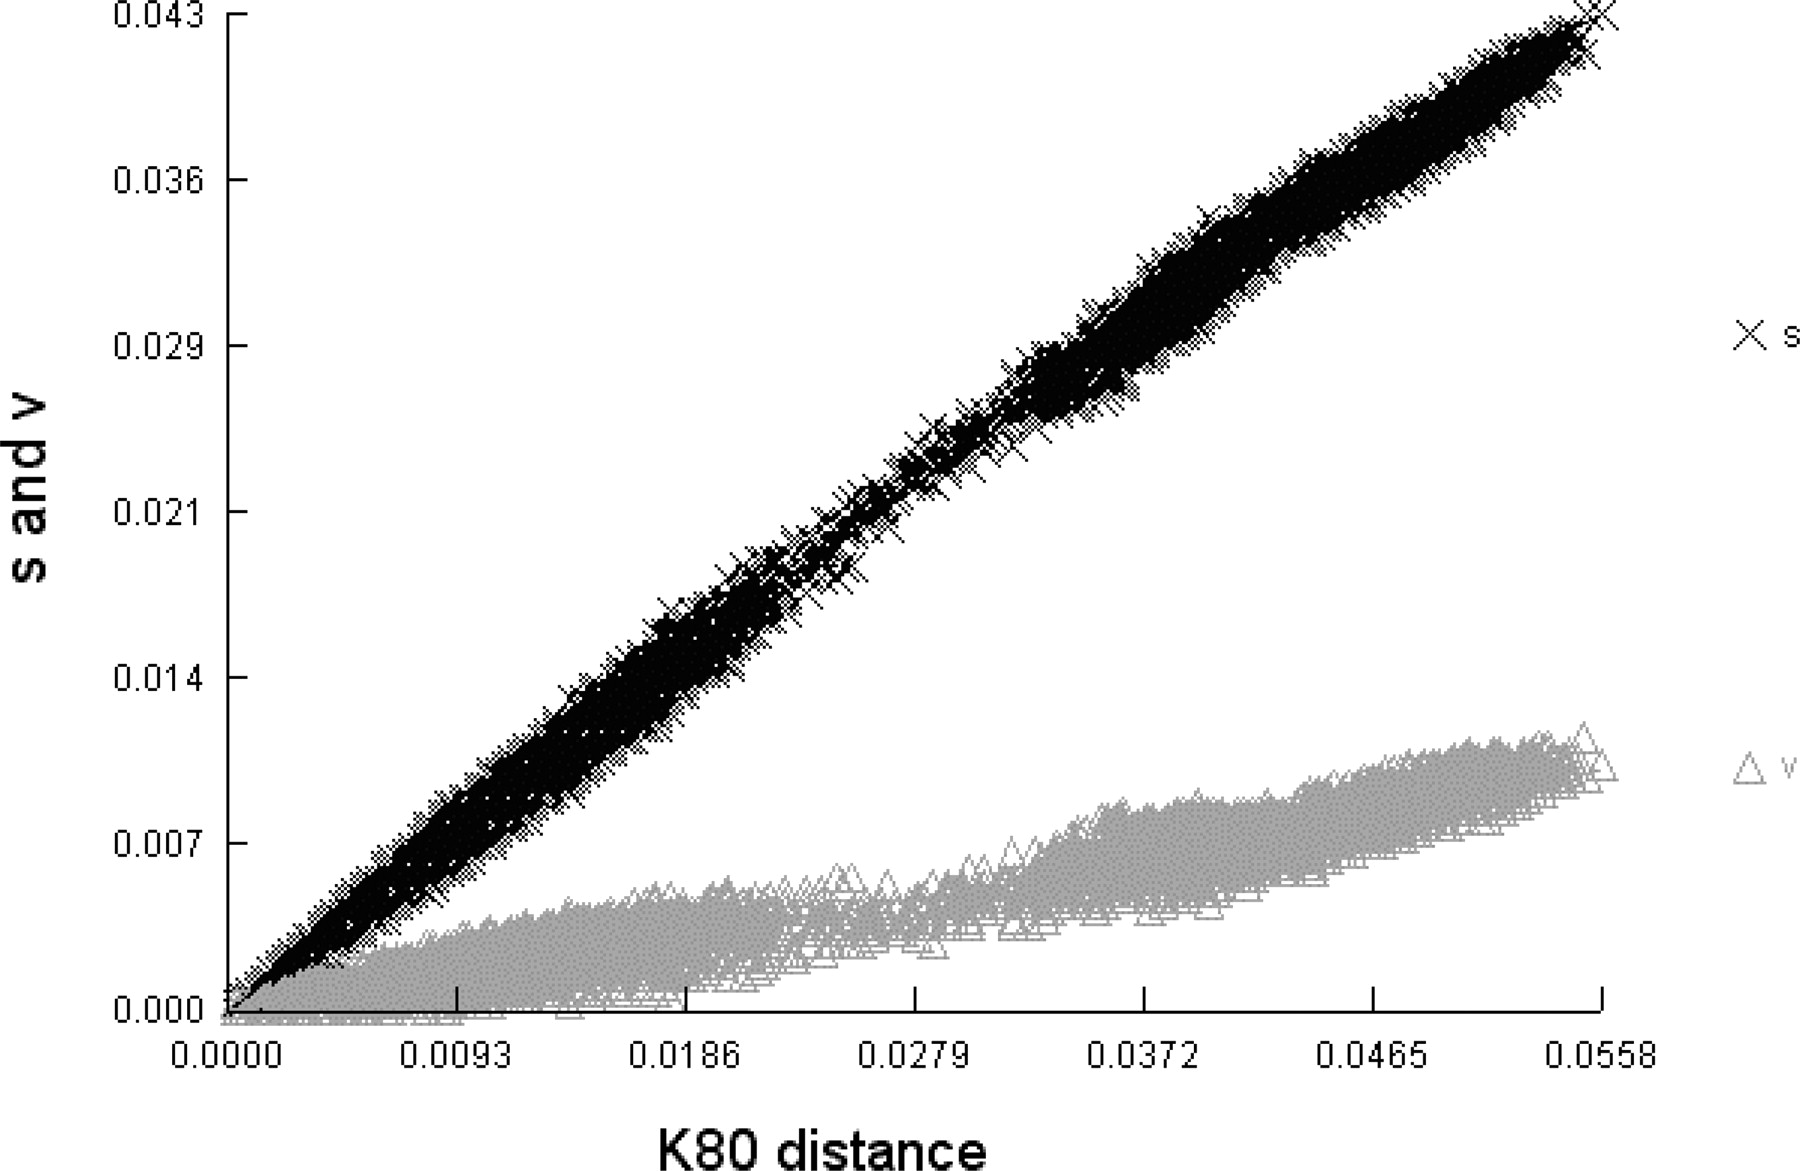
Figure 2.
Plots of transitions (black crosses) and transversions (gray triangles) versus genetic distance (Kimura two-parameter model; K80) for eight concatenated sequences. There is no apparent saturation.


