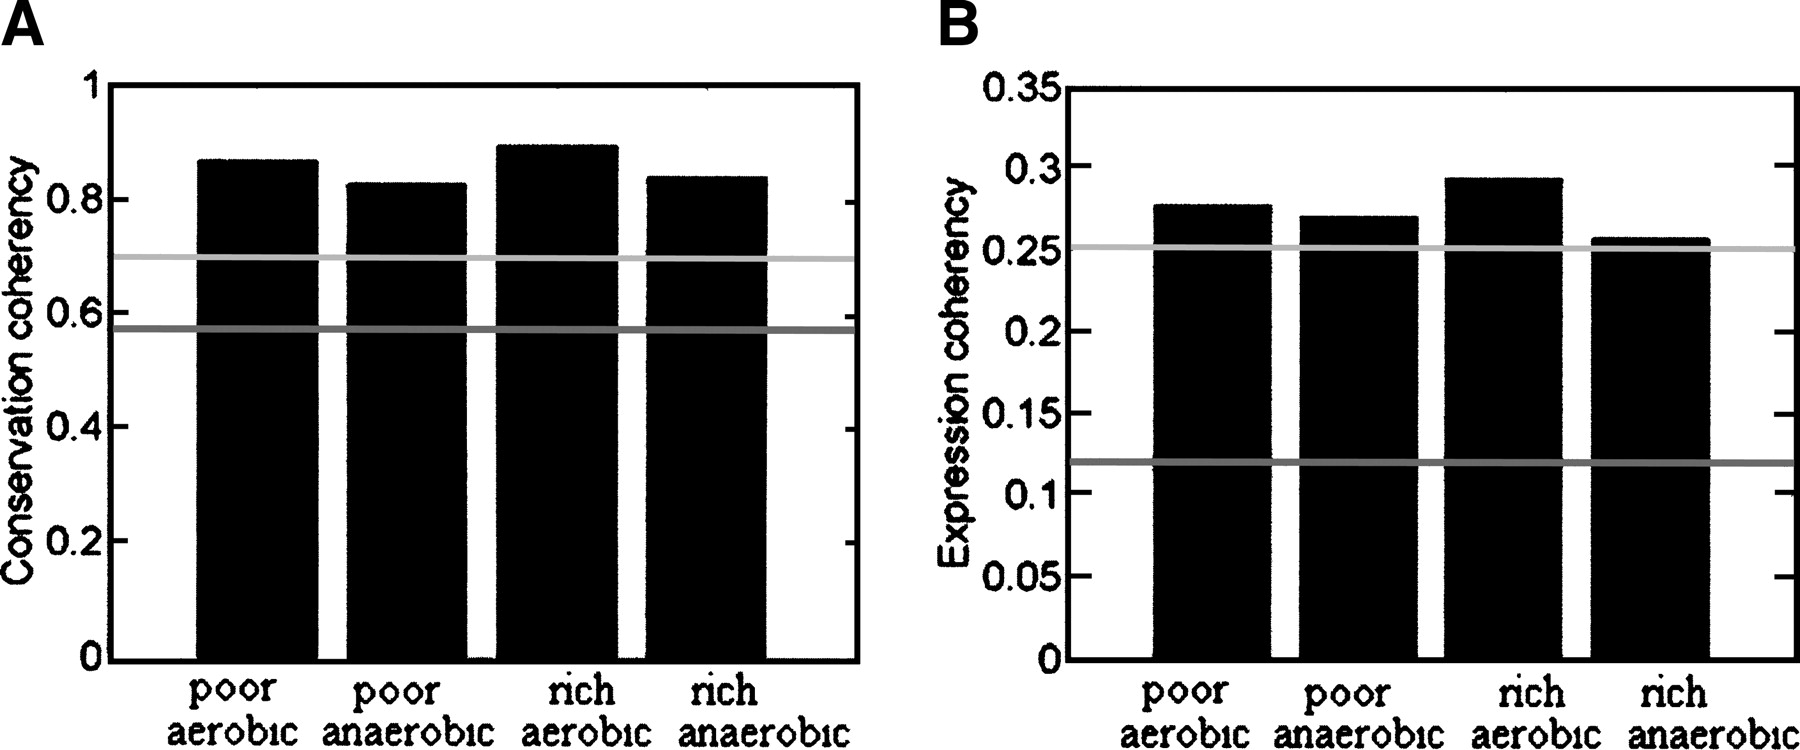
Systematic condition-dependent annotation of metabolic genes

(Downloading may take up to 30 seconds. If the slide opens in your browser, select File -> Save As to save it.)

Click on image to view larger version.

Figure 4.
Figure 4.

The conservation (A) and expression (B) coherency of the CDA under different conditions. The black and gray lines represent the coherency score obtained for a random annotation and for GO, respectively.

This Article

  1. Genome Res. 17: 1626-1633

Preprint Server