
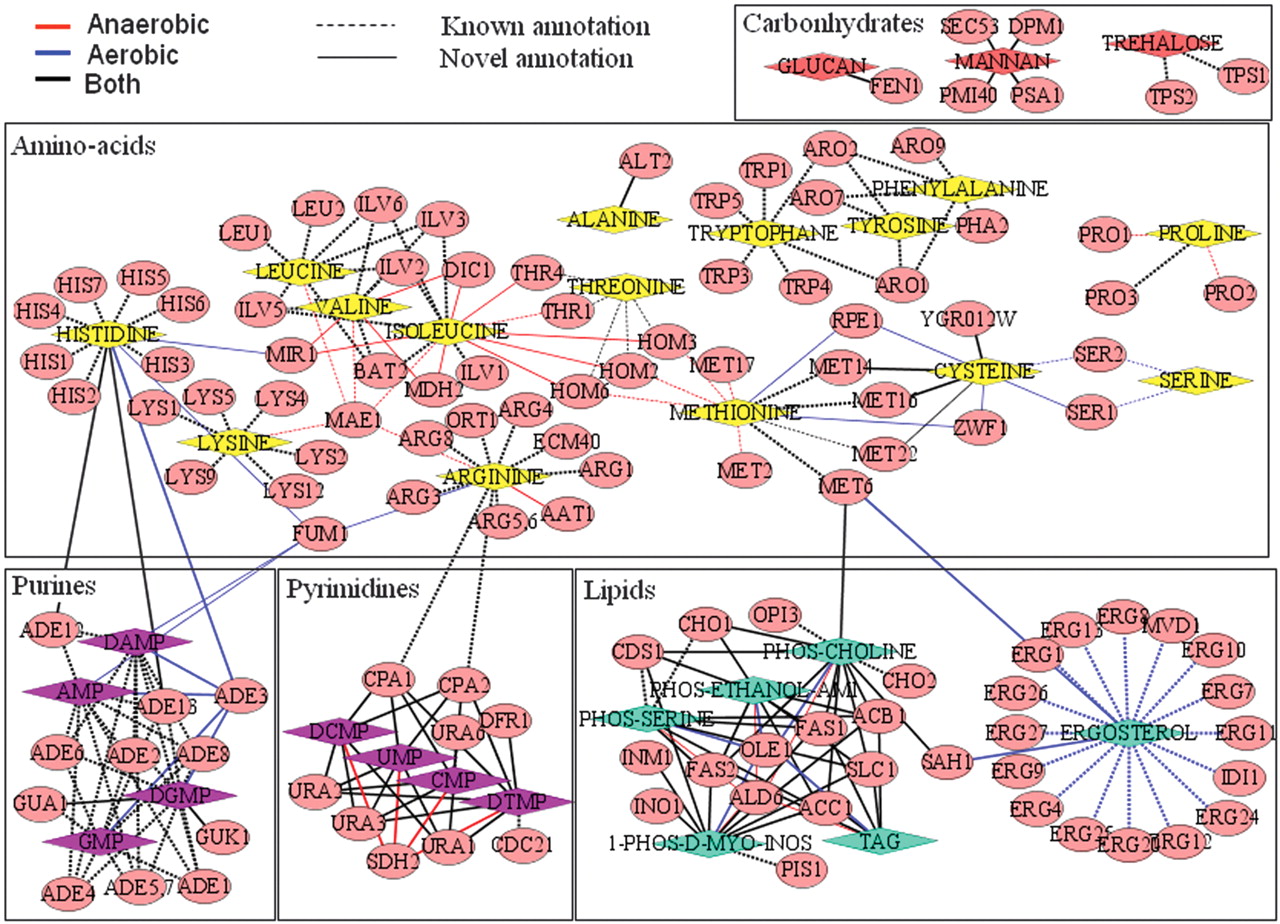
A network view of CDA in single knockout, poor media conditions, in aerobic and anaerobic conditions. Genes are marked with red circular nodes, and process terms with colored diamond nodes. Edges connecting between genes and processes denote annotation associations. Dotted lines represent annotations that are also present in GO. Wide edges represent an essential contribution of a gene to a process. Blue, red, and black edges represent contribution under aerobic, anaerobic, and both conditions, respectively. Note that several CDA annotations (e.g., in the pyrimidine biosynthesis cluster) have corresponding GO annotations that are highly nonspecific (Methods) and are hence considered here as novel.


