
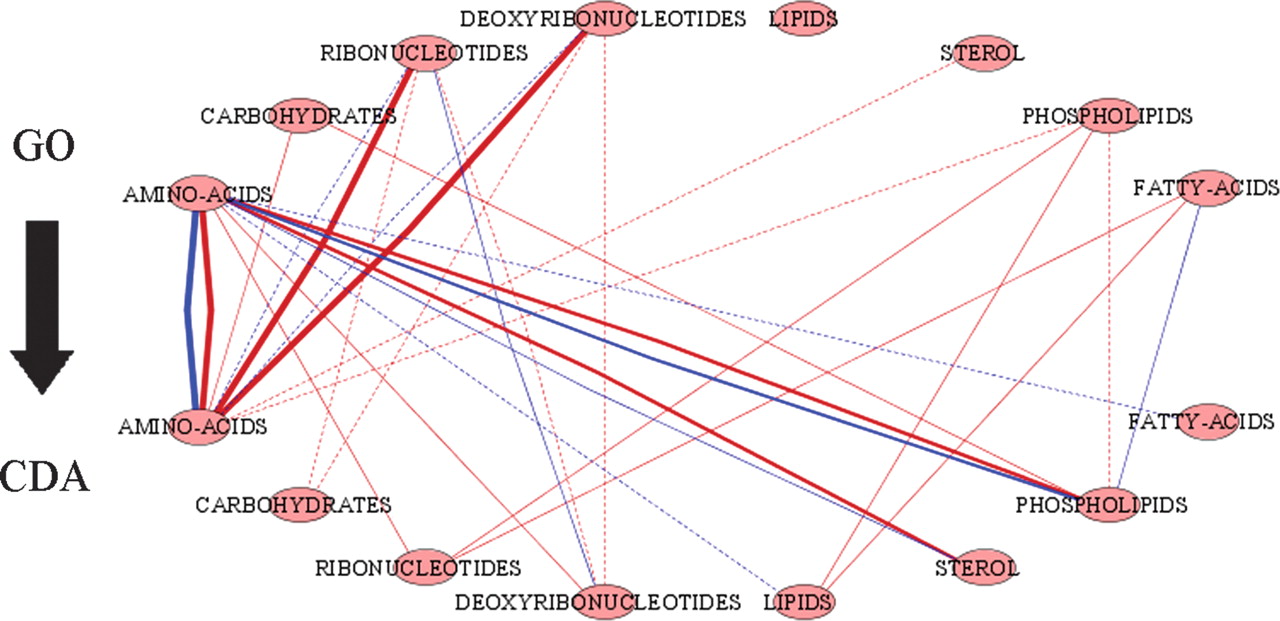
Figure 2.
Novel CDA predictions of known GO annotations. Nodes represent GO terms (top curve) and CDA terms (bottom curve). An edge between GO term x and CDA term y represents a set of novel CDA associations of genes annotated in GO as involved in term x, and annotated with term y in CDA. The width of the edge represents the set size. Blue and red edges represent annotations obtained with single and double knockouts, respectively.


