
Table 1.
A summary of coherent subnetworks
Click on table to view larger version.
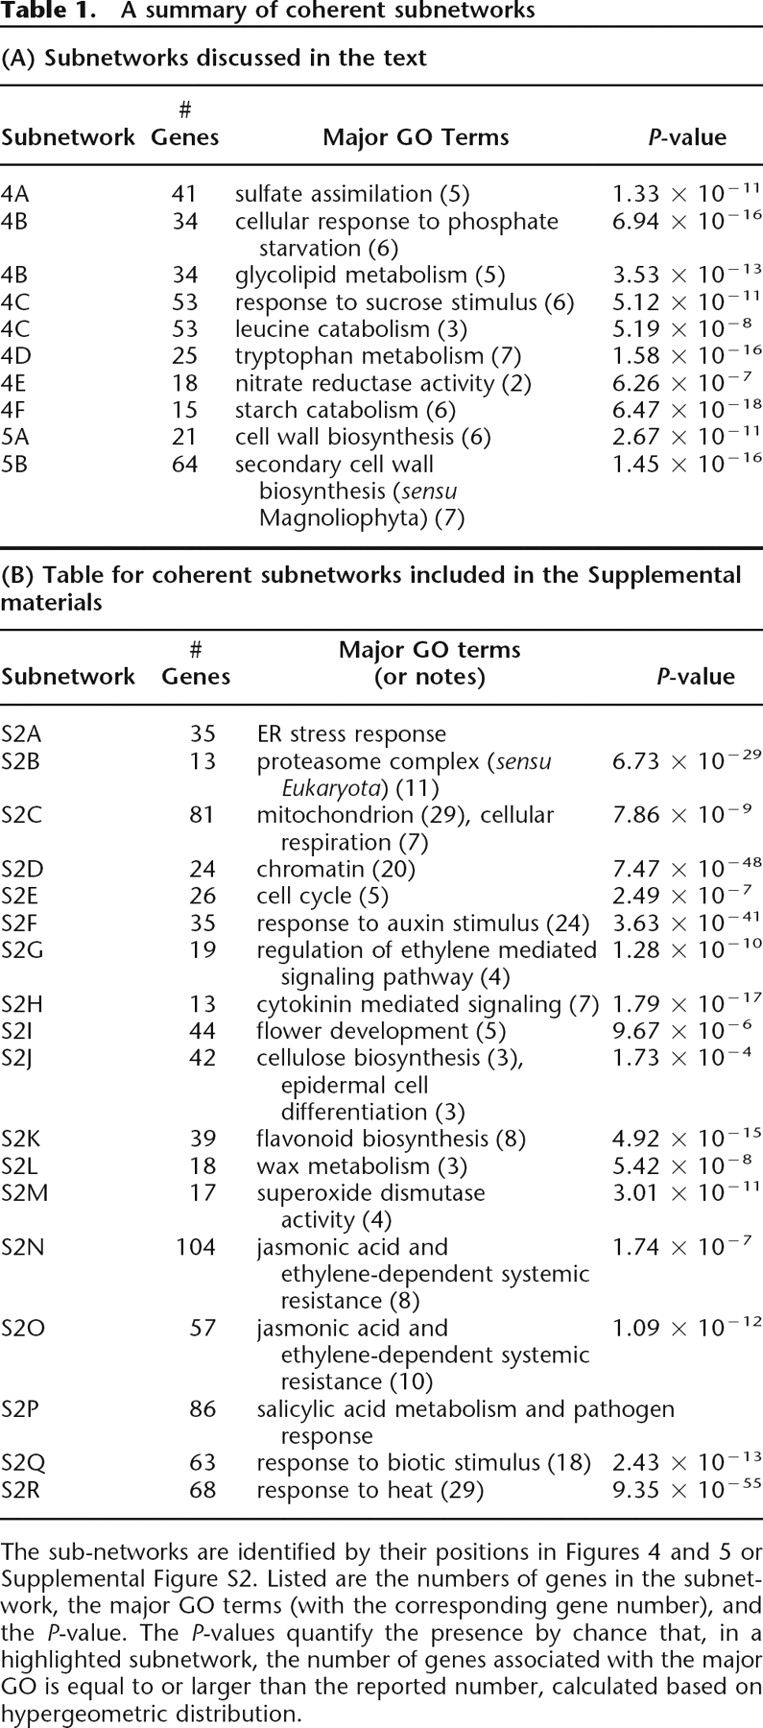
The sub-networks are identified by their positions in Figures 4 and 5 or Supplemental Figure S2. Listed are the numbers of genes in the subnetwork, the major GO terms (with the corresponding gene number), and the P-value. The P-values quantify the presence by chance that, in a highlighted subnetwork, the number of genes associated with the major GO is equal to or larger than the reported number, calculated based on hypergeometric distribution.


