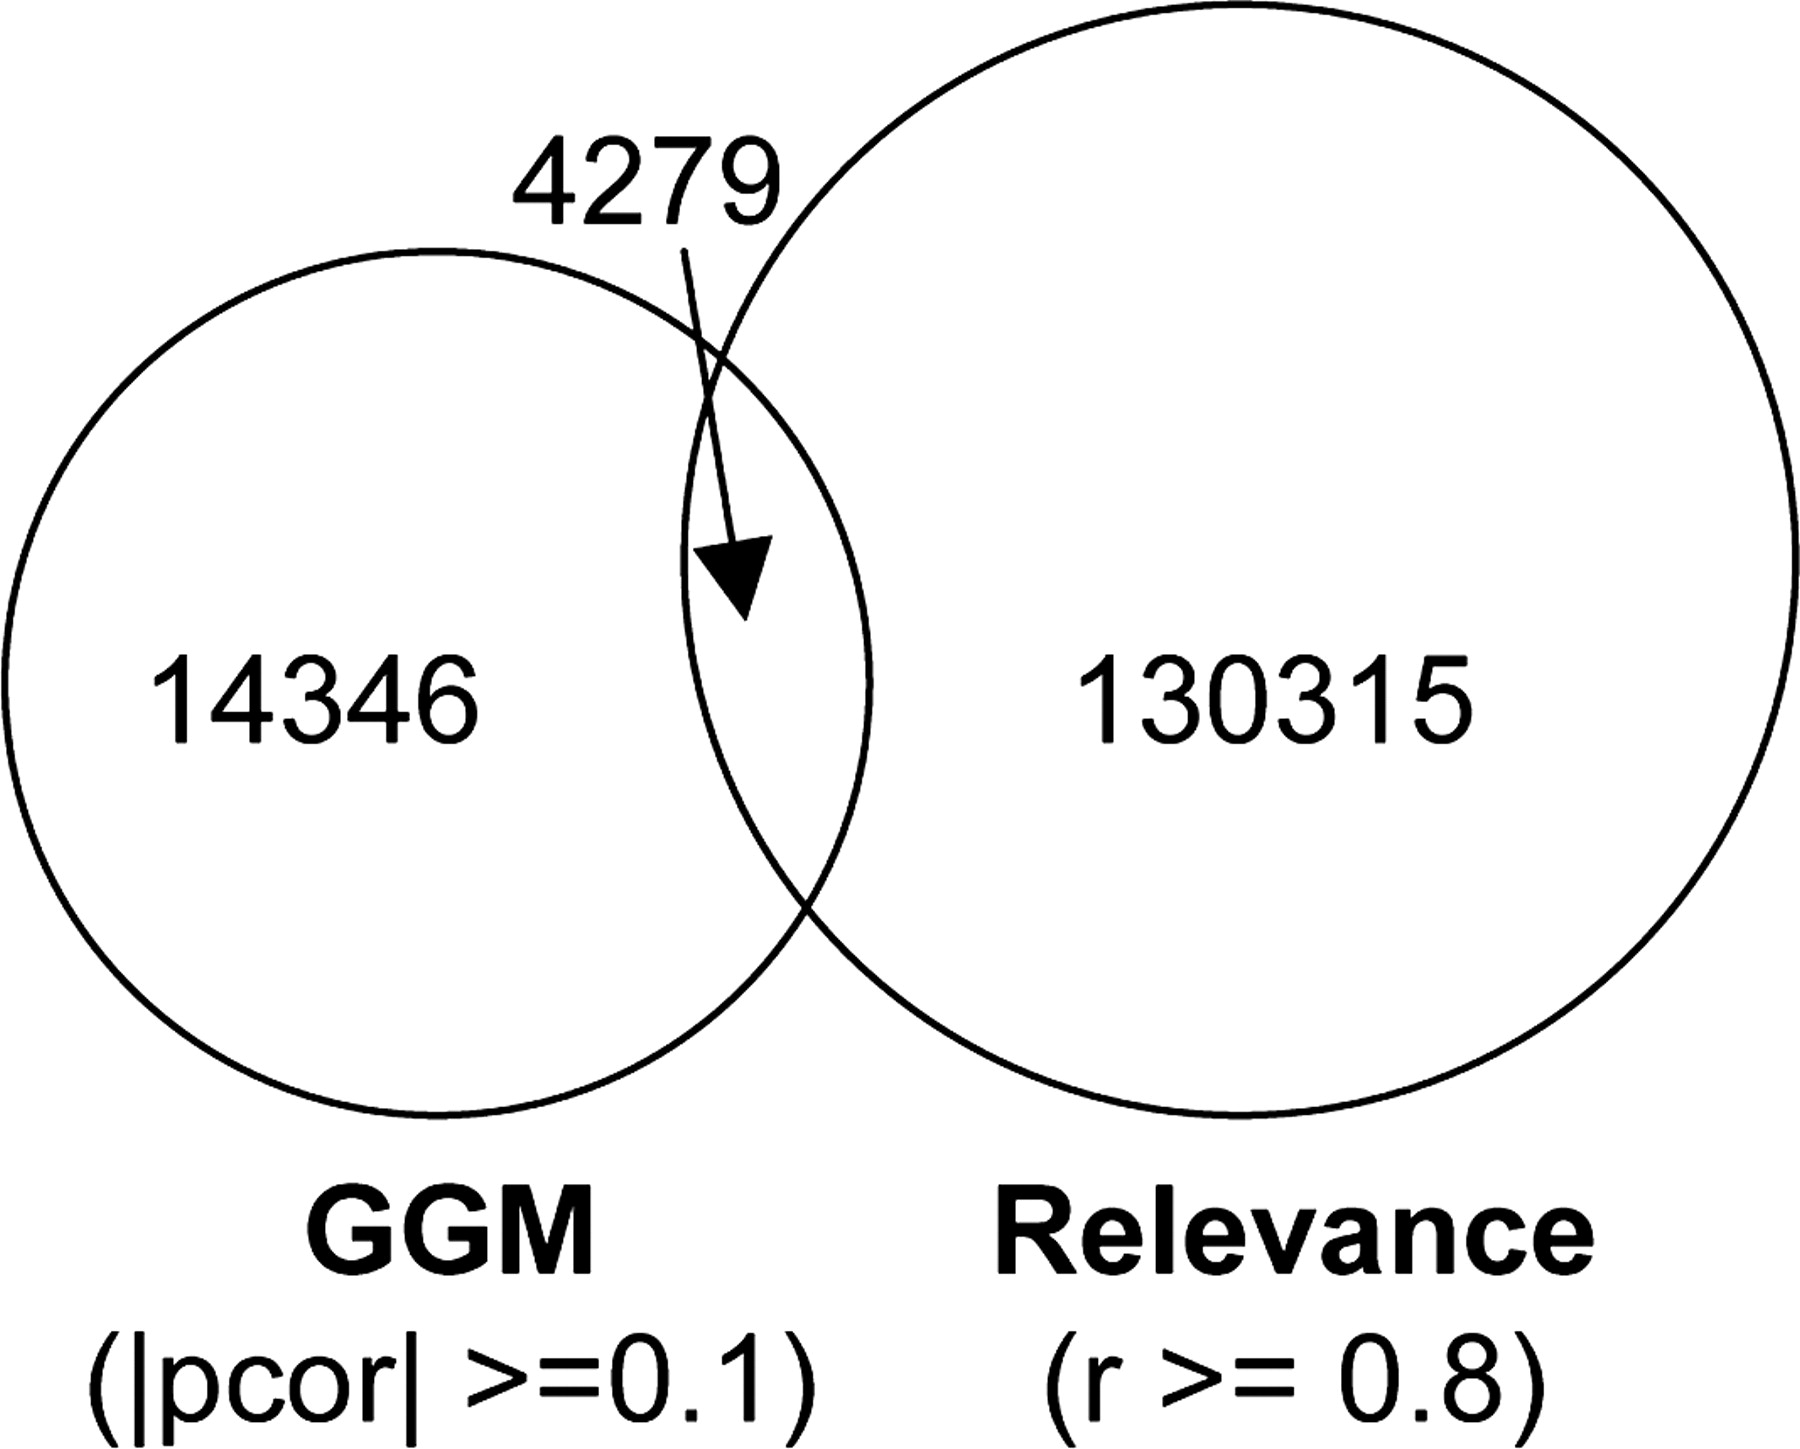
An Arabidopsis gene network based on the graphical Gaussian model

(Downloading may take up to 30 seconds. If the slide opens in your browser, select File -> Save As to save it.)

Click on image to view larger version.

Figure 7.
Figure 7.

Venn diagram outlining overlap and differences between the GGM and relevance network approaches. Numbers indicate the number of interactions recovered by the two methods.

This Article

  1. Genome Res. 17: 1614-1625

Preprint Server