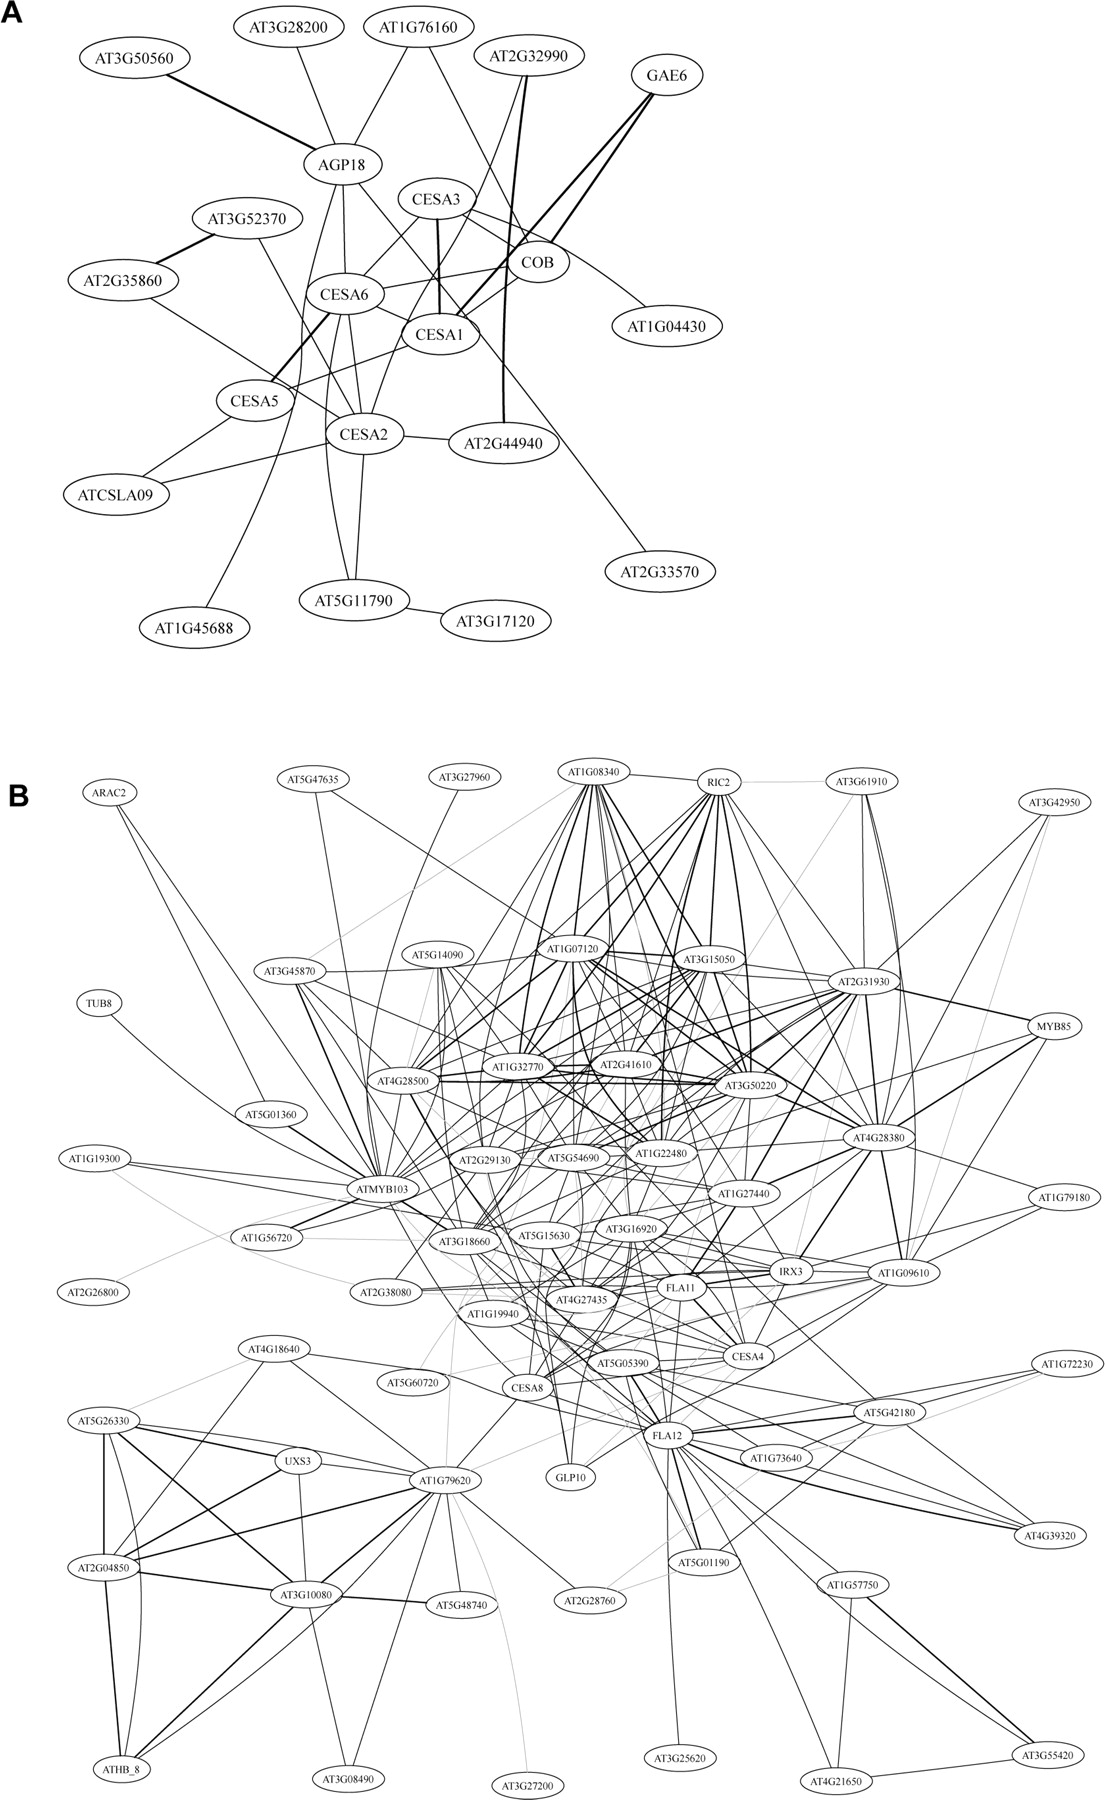
An Arabidopsis gene network based on the graphical Gaussian model

(Downloading may take up to 30 seconds. If the slide opens in your browser, select File -> Save As to save it.)

Click on image to view larger version.

Figure 5.
Figure 5.

Subnetworks for cell wall biosynthesis. (A) Genes centered on CESA6 (note: this subnetwork is drawn from edges with pcor >0.08, i.e., lower stringency). (B) Genes centered on CESA8. Symbols as in Figure 2.

This Article

  1. Genome Res. 17: 1614-1625

Preprint Server