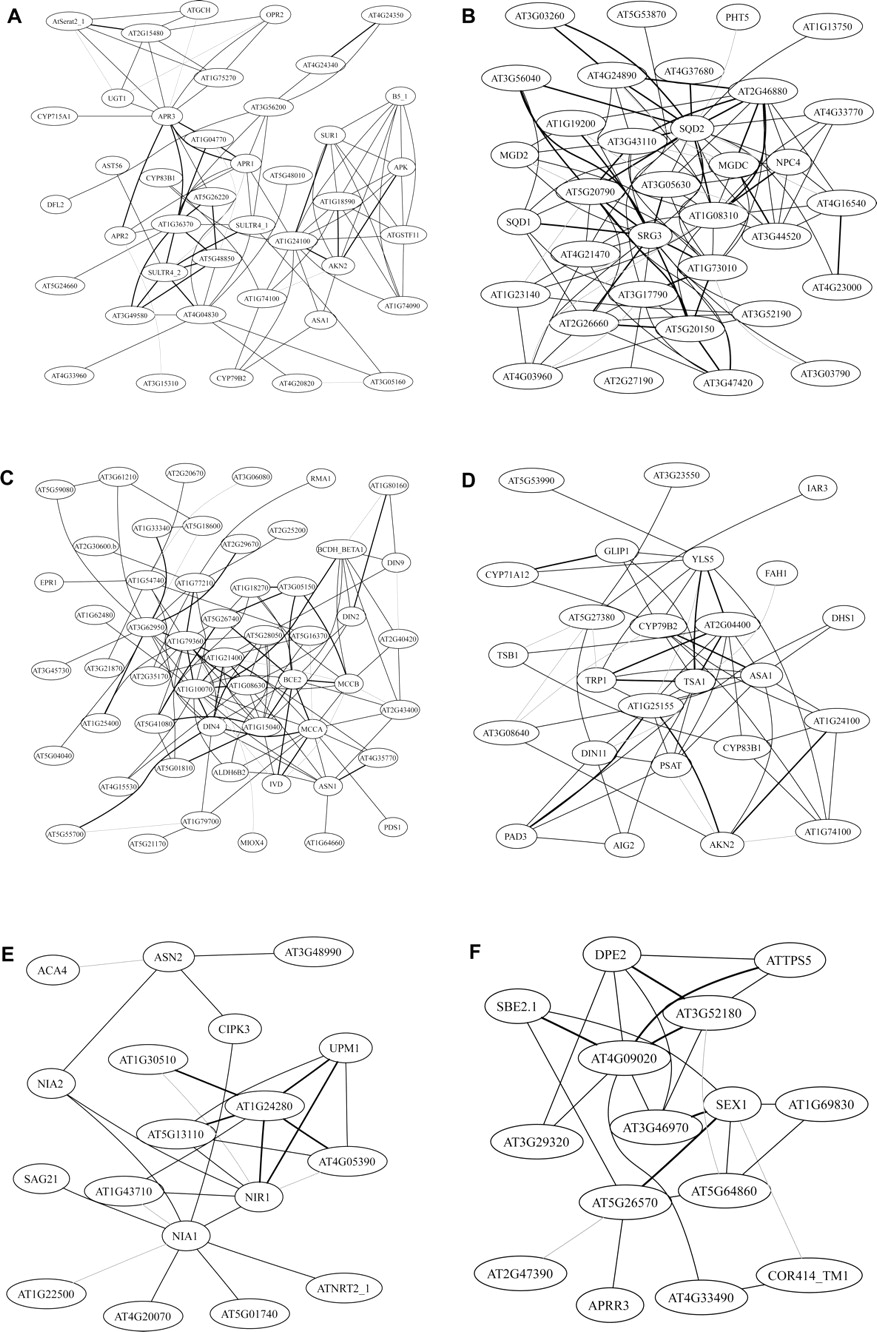
An Arabidopsis gene network based on the graphical Gaussian model

(Downloading may take up to 30 seconds. If the slide opens in your browser, select File -> Save As to save it.)

Click on image to view larger version.

Figure 4.
Figure 4.

Subnetworks extracted from the expanded network. The examples are centered on (A) APR1; (B) SQD1; (C) DIN4; (D) TRP1; (E) NIA2; and (F) SBE2.1. Symbols as in Figure 2.

This Article

  1. Genome Res. 17: 1614-1625

Preprint Server