
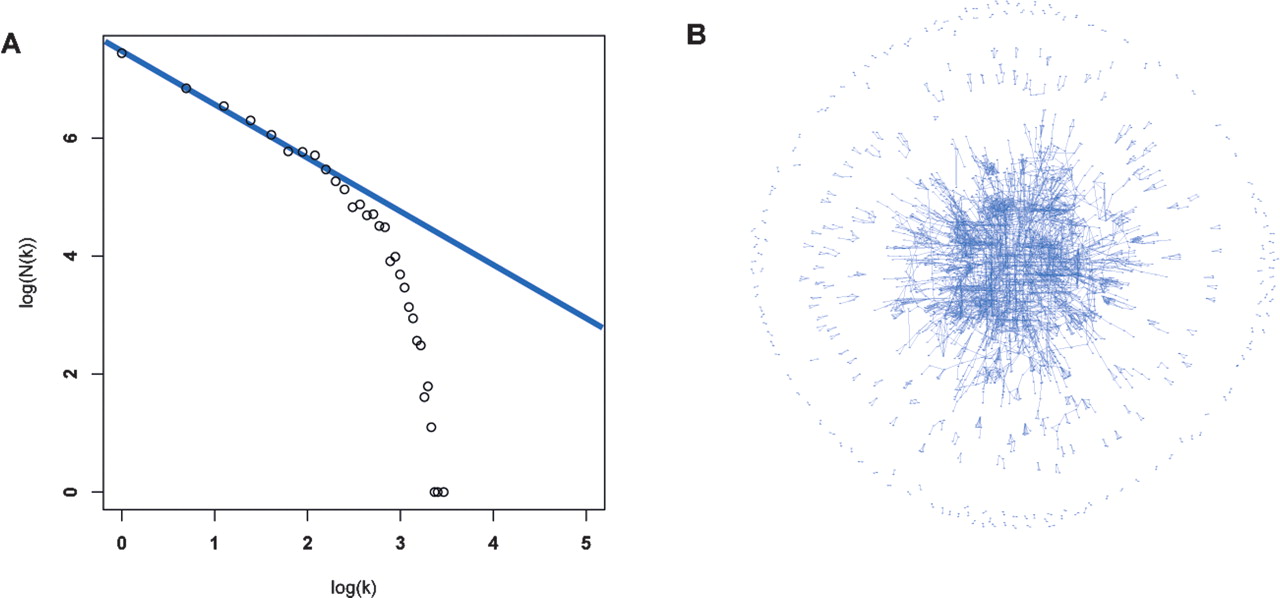
Figure 3.
Connectivity and network structure. (A) The connectivity distribution for the expanded network (k) Connectivity; (N(k)) number of nodes with connectivity k. The line indicates the distribution expected for a network following the power law. (B) An overview of the network (with 5000 edges included), as generated by the tYNA platform.


