
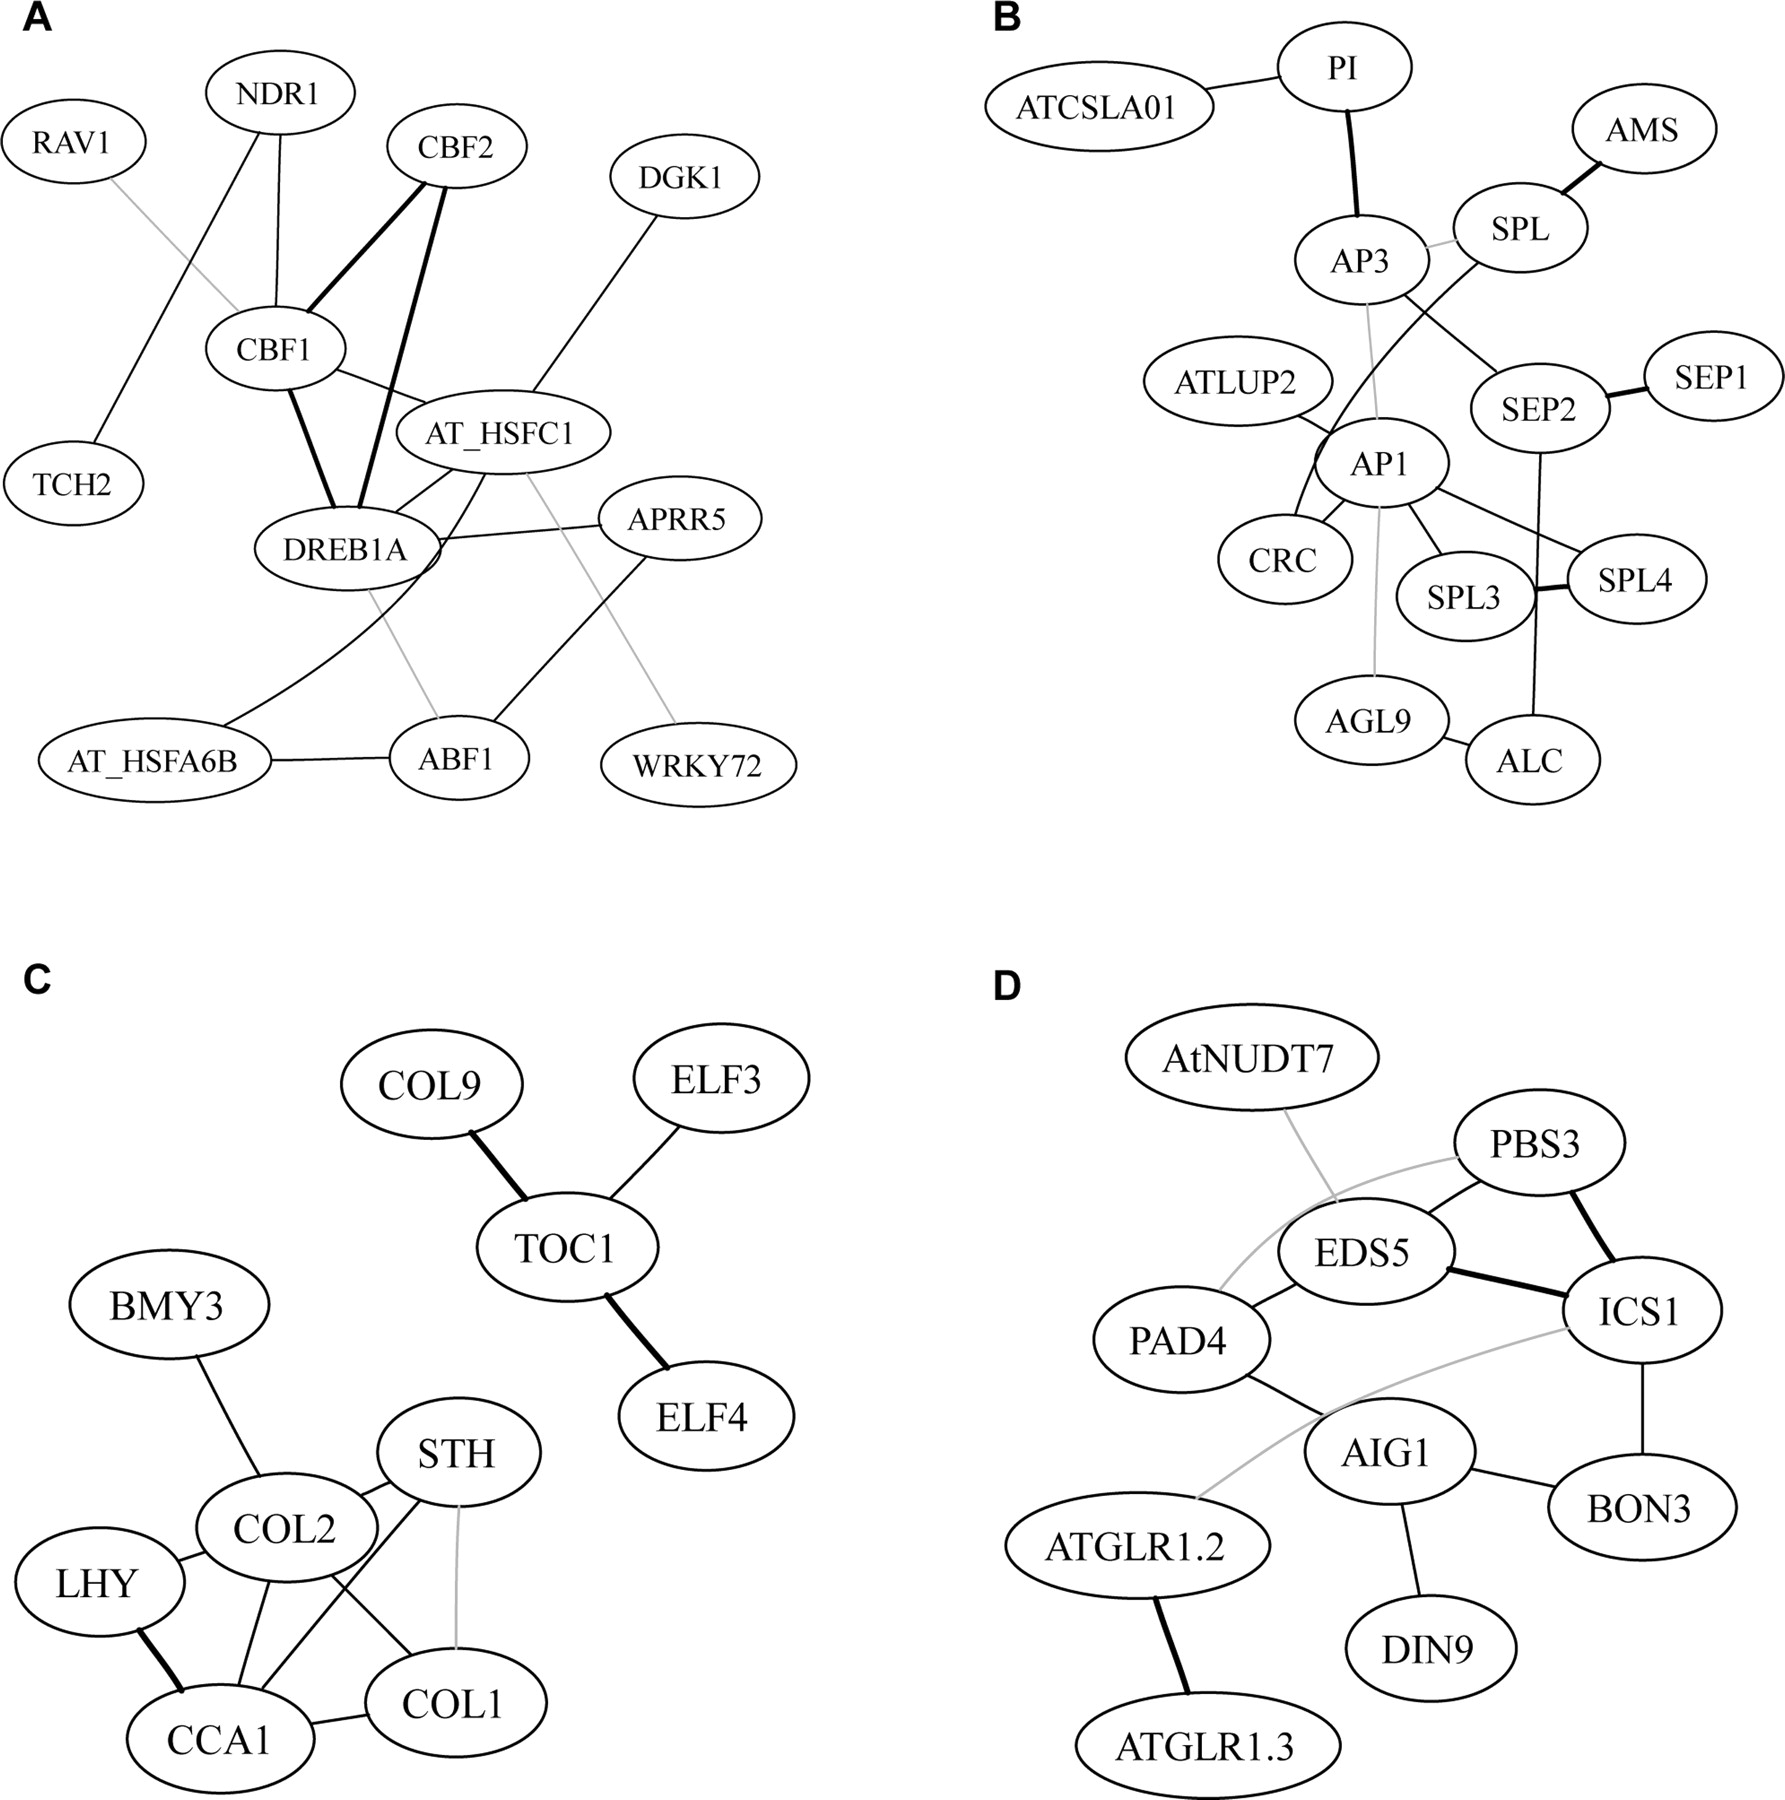
Figure 2.
Subnetworks in a pilot experiment with functionally characterized genes. The subnetworks were derived from seeded nodes, and including all other nodes within two connections from seeded nodes (four for PAD4). The seed nodes in each subnetwork are (A) CBF1; (B) AP3; (C) CCA1 and TOC1; (D) PAD4. Within each subnetwork, a link between two nodes indicates direct interactions. Black indicates edges with the highest 20% pcor values, gray lines indicate edges at the lower 20% pcor, and dashed lines indicate negative interactions.


