
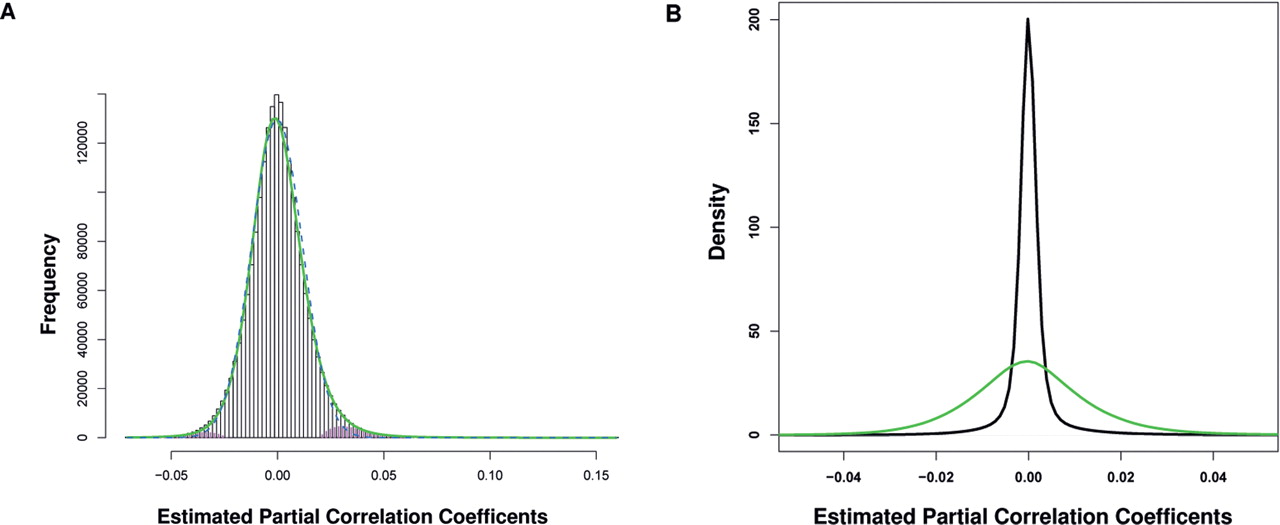
Figure 1.
The distribution of estimated partial correlations. (A) Distribution of pcors for 2000 named and at least partially studied genes. (Bars) Histogram; (green line) distribution of estimated pcor after Fisher’s normalizing z-transformation; (dashed blue line) fitted null distribution; (pink) alternative distribution, inferred by the locfdr algorithm (Efron 2004, 2007). (B) Comparison of the pcor distribution in the pilot experiment (green line) and the expanded calculation (dark line). Shown is the area between –0.05 and 0.05. Densities were calculated using the kernel density estimator embedded in R, with the bandwidth set to 0.001.


