
Sequence features of stable and rearranged chicken genomic regions
Click on table to view larger version.
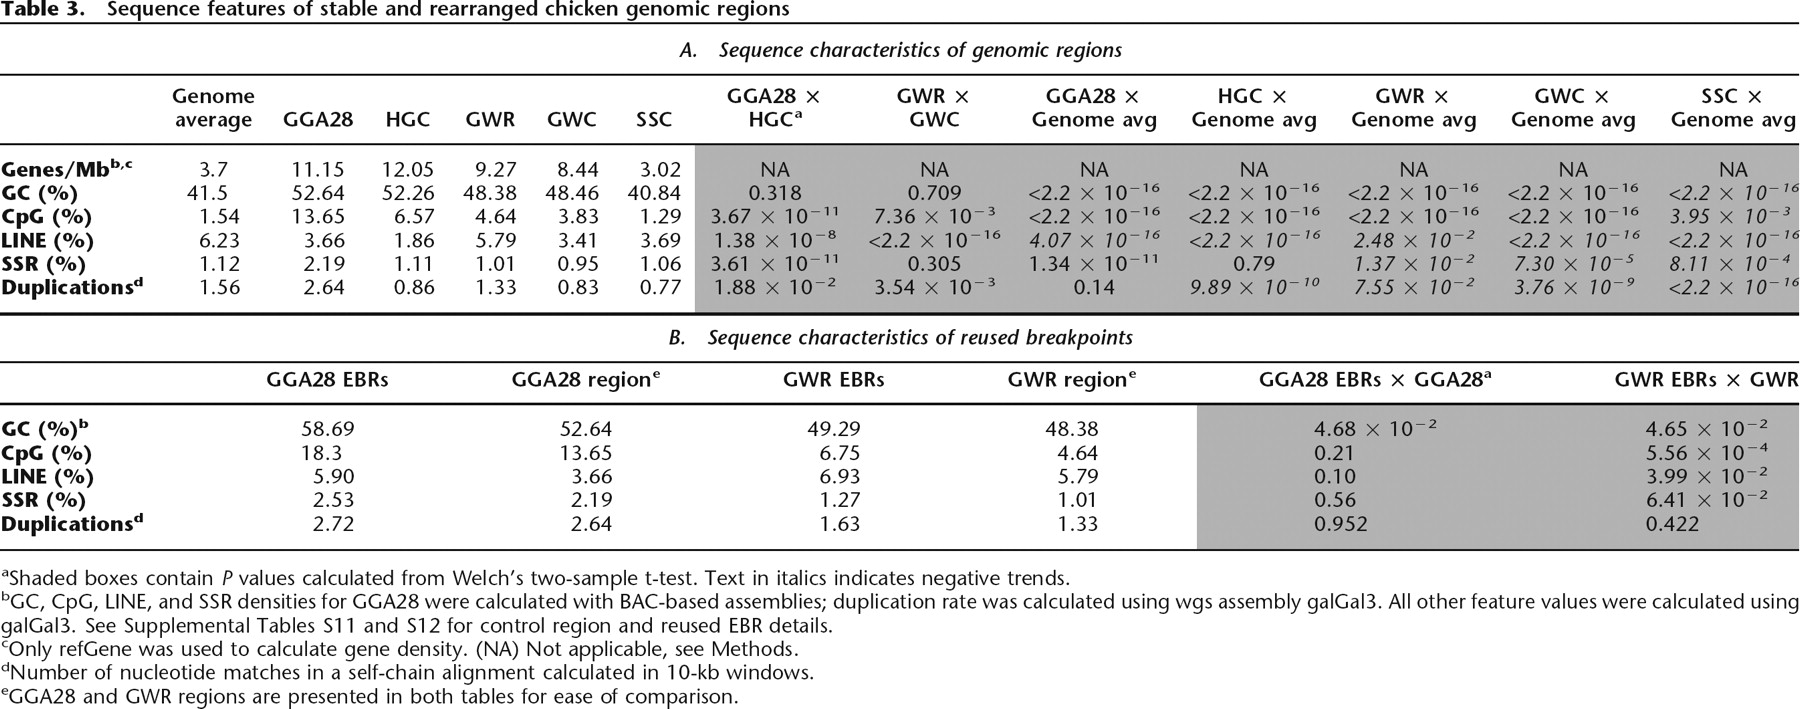
aShaded boxes contain P values calculated from Welch’s two-sample t-test. Text in italics indicates negative trends.
bGC, CpG, LINE, and SSR densities for GGA28 were calculated with BAC-based assemblies; duplication rate was calculated using wgs assembly galGal3. All other feature values were calculated using galGal3. See Supplemental Tables S11 and S12 for control region and reused EBR details.
cOnly refGene was used to calculate gene density. (NA) Not applicable, see Methods.
dNumber of nucleotide matches in a self-chain alignment calculated in 10-kb windows.
eGGA28 and GWR regions are presented in both tables for ease of comparison.


