
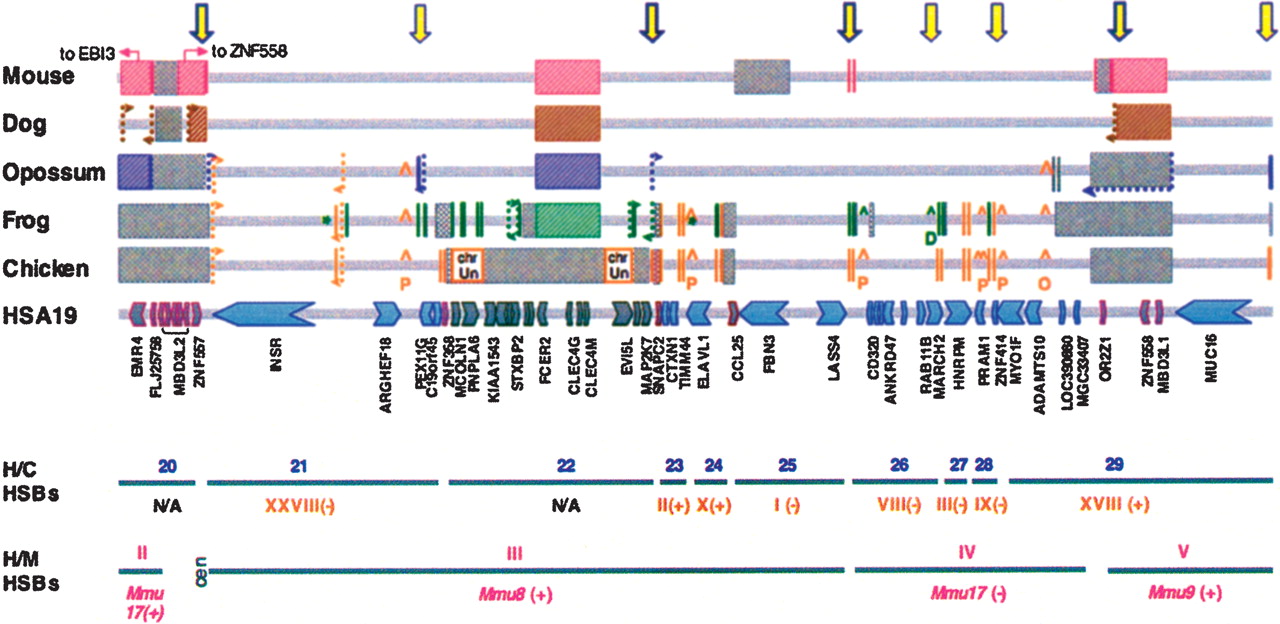
Chromosome rearrangement map for 2 MB of rearrangement prone GGA28-related regions of HSA19p. Using the finished HSA19 sequence (hg18) and the high-quality, BAC-based draft sequence for GGA28 as a base, homology breaks and synteny changes relative to HSA19p are detailed for five vertebrate species. Genes and gene order for mouse, dog, opossum, and frog were manually inspected in related regions using wgs draft assemblies mm8, canFam2, monDom4, and xenTro2 (UCSC Genome Browser; http://genome.ucsc.edu/). Relative order, orientation, and spacing of HSA19 gene loci are represented with a series of arrows; blue arrows indicate a chicken ortholog, gray arrows indicate HSA19 loci that were not found in any GGA28 assembly. The relative location of chicken-specific loci are noted with carats (^). (P) Paralog; (O) non-HSA19 ortholog; (D) duplication. Homology breaks for chicken (orange), frog (green), opossum (purple), dog (brown), and mouse (pink) are indicated by paired vertical lines; each line delineates the end of a genomic region that was found to be flanked by a different homology segment in the other species, two per breakpoint. Where two species share an alternate syntenic configuration relative to human, a single color is used. Thus, breakpoints marked with different colors indicate flanking segments that have been differentially joined, i.e., “reused” in different rearrangement events. Reused breakpoints are marked with a yellow arrow (light outline, 2 species; heavy outline, ≥3 species). Inversion breaks within homology segments are dotted and paired with arrows to track related breakpoints. Scaffold breaks in draft wgs assemblies are presented in gray; at these sites it could not be definitively determined whether the flanking segment is or is not changed relative to human. Differentially expanded gene family regions are marked with color-coded hatched lines. Missing genes and regions are marked with gray cross-hatched lines. Human/chicken (H/C) and human/mouse (H/M) HSBs are presented beneath. See Supplemental Figure S2 for a comprehensive map of all GGA28-related regions of HSA19p and full pictorial legend of annotation marks.


