
Table 4.
Information measures in SeattleSNPs/PARC data after correction for bias due to short sequence lengths derived from ENCODE data
Click on table to view larger version.
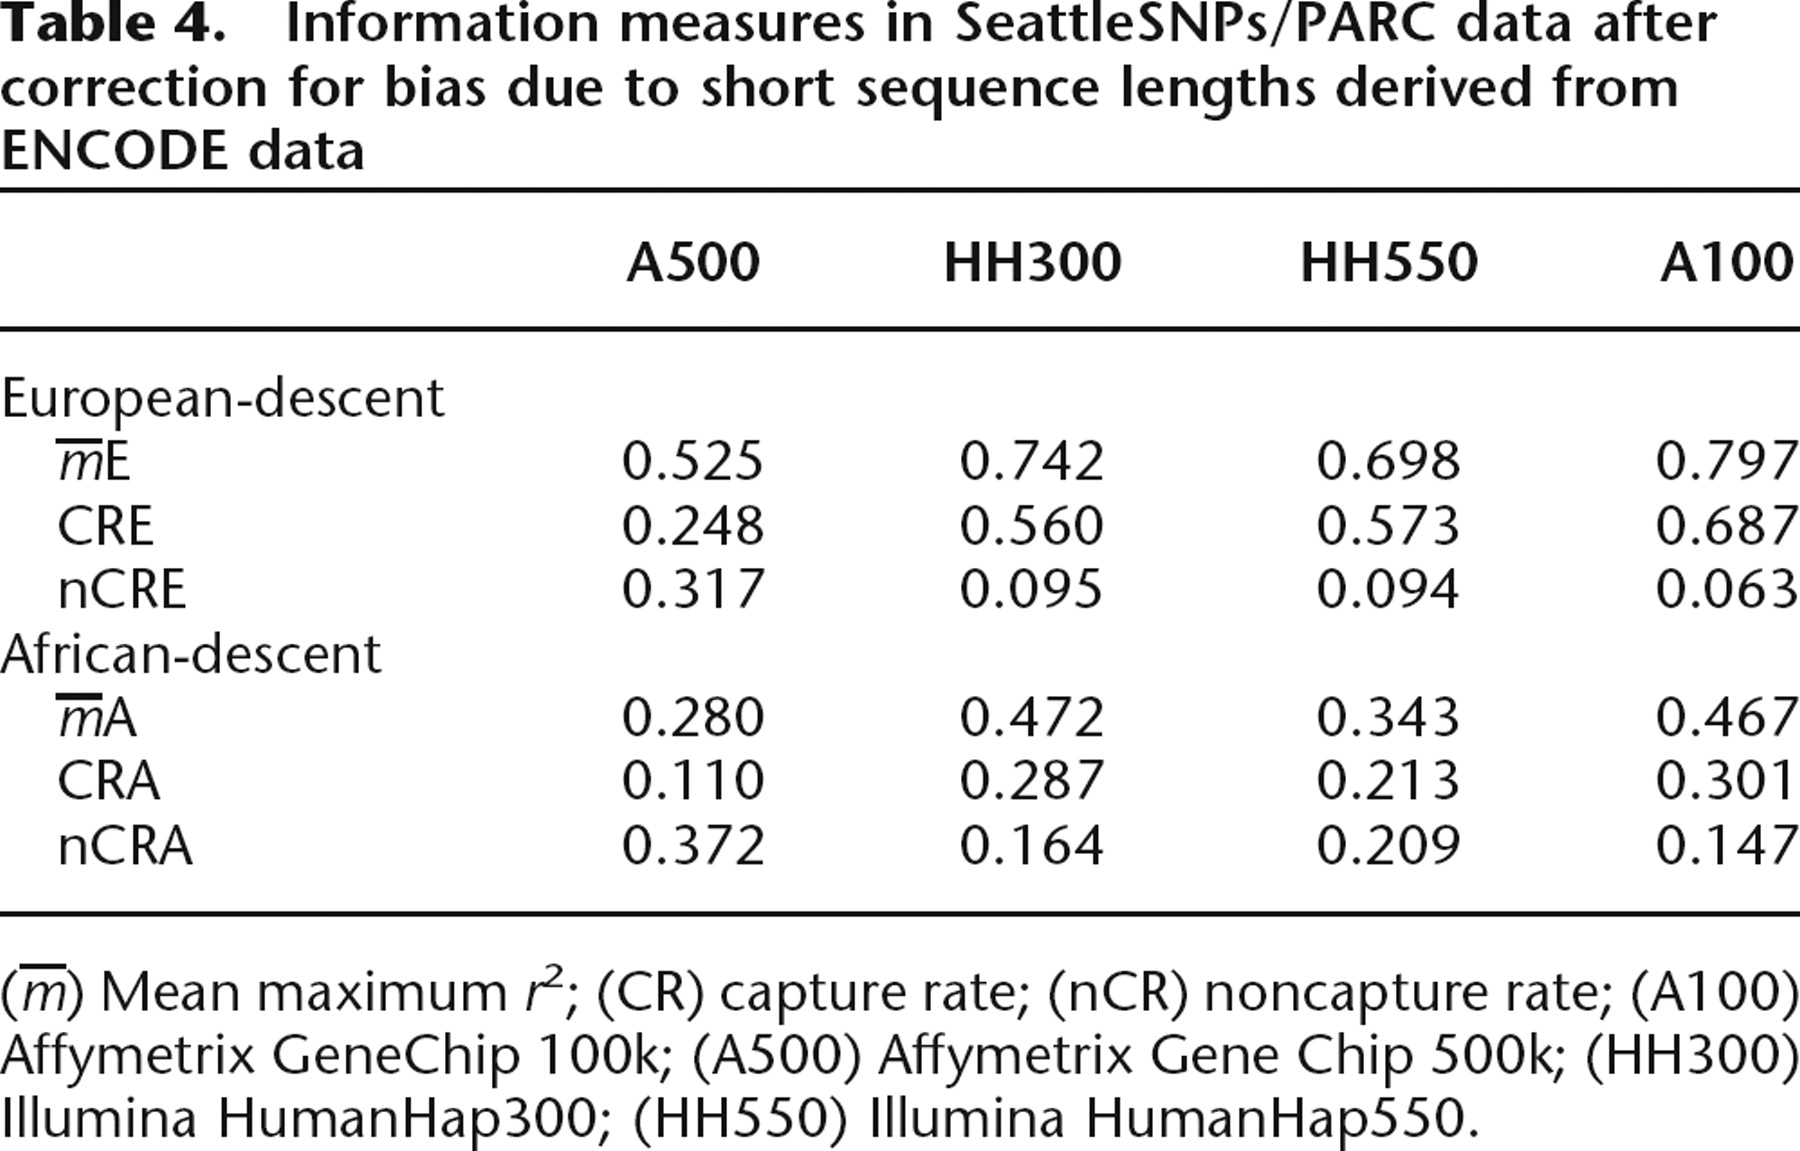
(m̅) Mean maximum r2; (CR) capture rate; (nCR) noncapture rate; (A100) Affymetrix GeneChip 100k; (A500) Affymetrix Gene Chip 500k; (HH300) Illumina HumanHap300; (HH550) Illumina HumanHap550.


