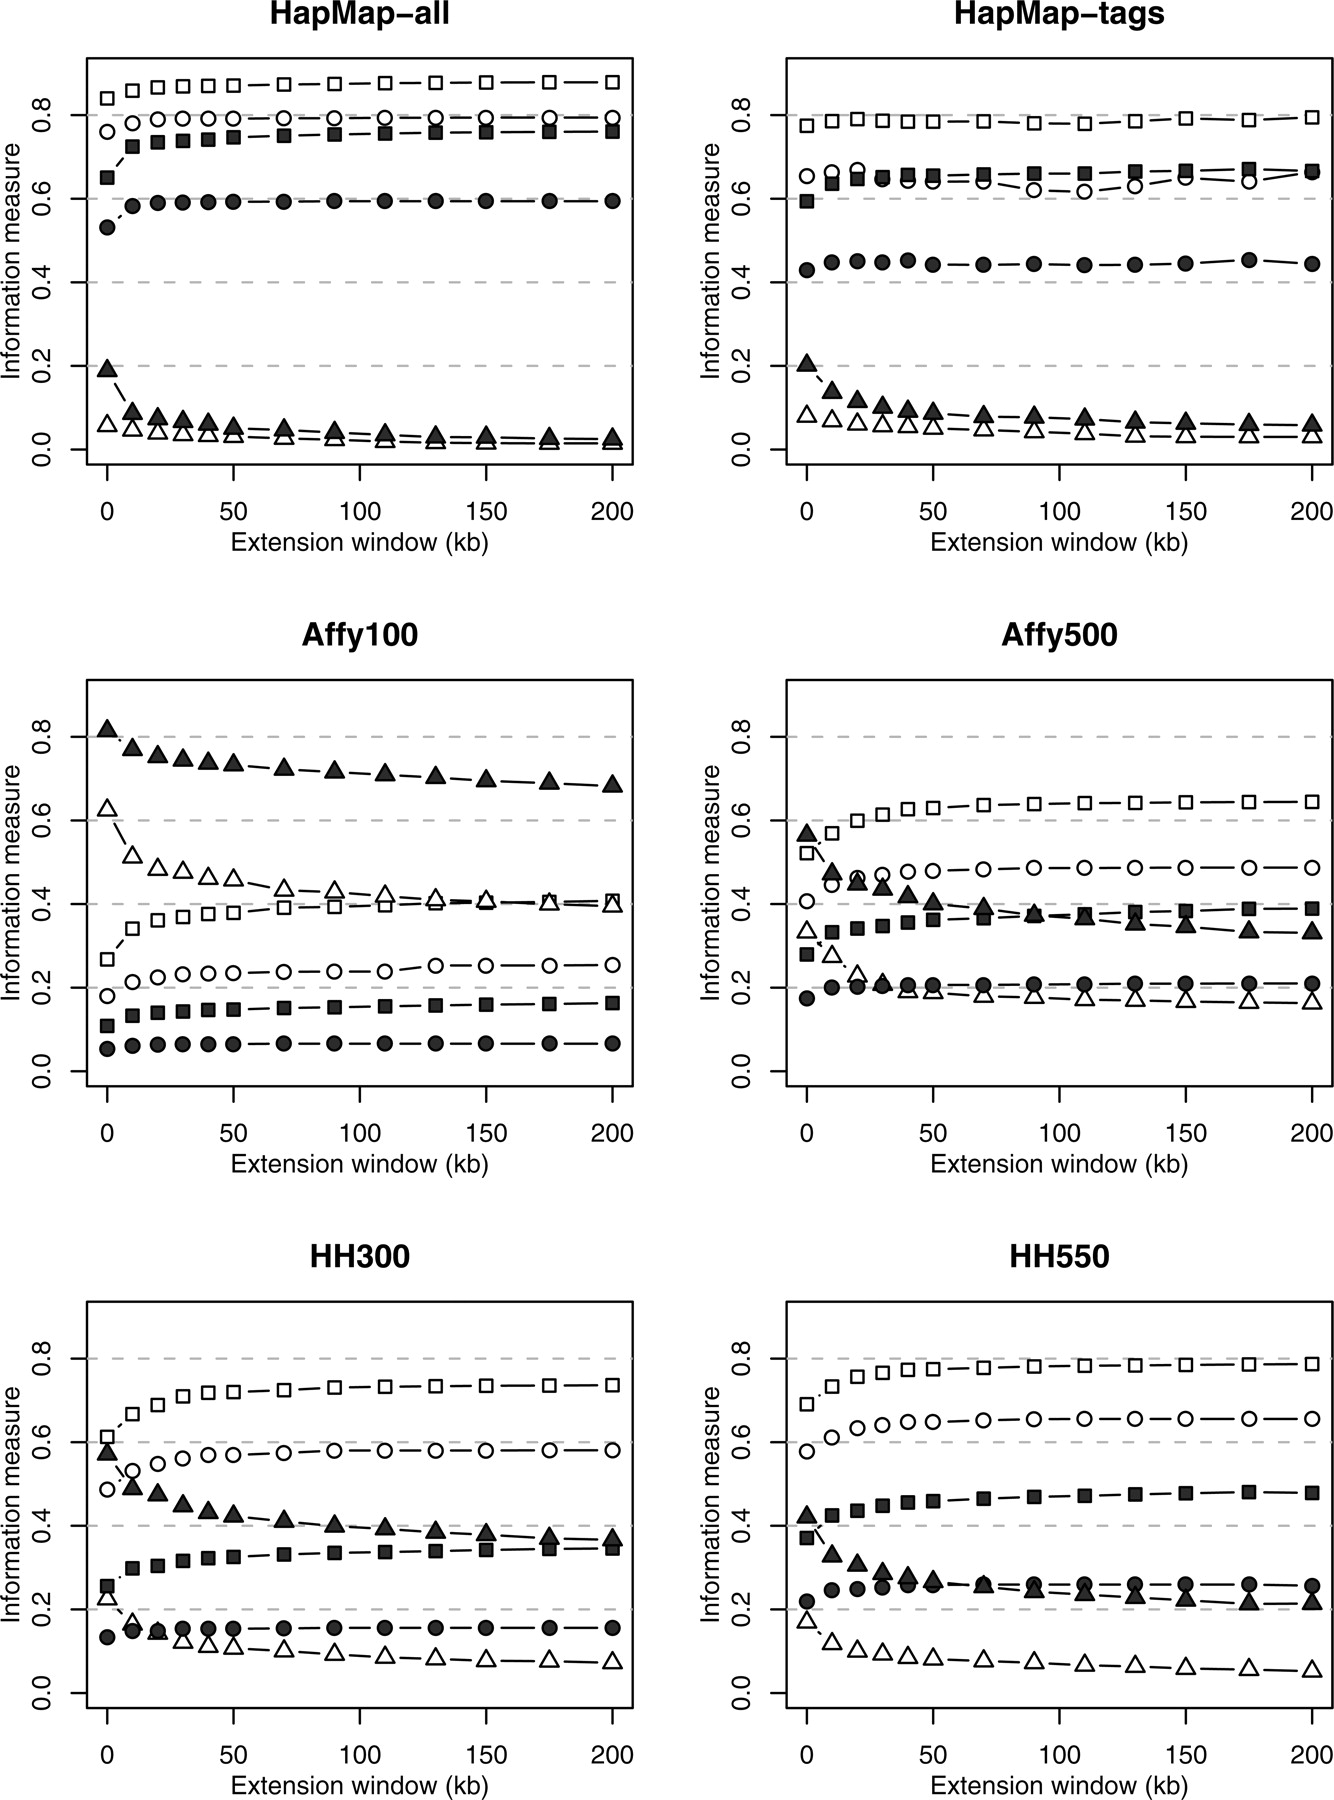
Information capture using SNPs from HapMap and whole-genome chips differs in a sample of inflammatory and cardiovascular gene-centric regions from genome-wide estimates

(Downloading may take up to 30 seconds. If the slide opens in your browser, select File -> Save As to save it.)

Click on image to view larger version.

Figure 1.
Figure 1.

Information measures for 78 genes using combined SeattleSNPs/PARC and HapMap data for extension windows of 0–200 kb around the sequenced region. Mean maximum r2, capture rates, and noncapture rates are shown by squares, circles, and triangles, respectively; European and African descent samples are distinguished by solid and open symbols, respectively.

This Article

  1. Genome Res. 17: 1596-1602

Preprint Server