
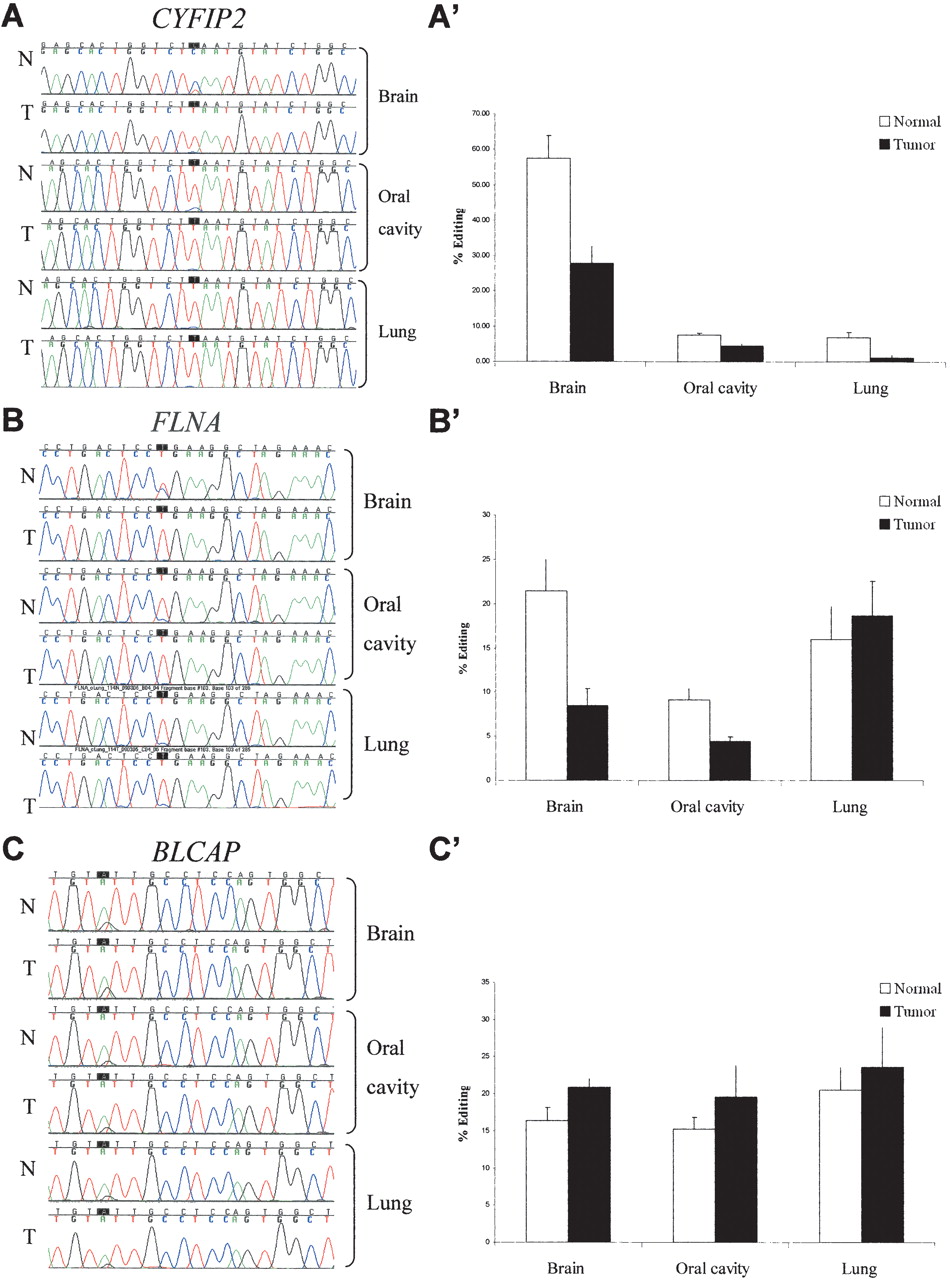
Site-specific editing at coding sequences in normal vs. tumor tissues; direct sequencing of the CYFIP2, FLNA, and BLCAP genes (A–C) from representative samples taken from normal and cancer tissues (brain, oral cavity, and lung). Editing position is indicated by a black box. A-to-I editing is detected as guanosine trace when products were sequenced with the forward primer and as cytidine trace when reverse primer was used for sequencing. Paired normal and tumor tissues from lung and oral cavity were taken from the same individual. (A′–C′) Average editing levels of CYFIP2, FLNA, and BLCAP in normal and cancer tissues. Normal and tumor samples are indicated by white and black bars, respectively. Error bars represent SEM (A–A′) CYFIP2 shows the highest editing percentages in brain tissues, with pronounced 2.4-fold higher editing levels in normal vs. tumor brains (51.5% [n = 13] and 22.3% [n = 27], respectively; P = 0.002). (B–B′) Highest editing percentages of FLNA were detected in the brain tissue, with a significant 2.4-fold higher editing in normal vs. tumor brains (21.4% [n = 13] and 8.8% [n = 31], respectively; P = 0.0001). (C–C′) Minor increase in editing level of BLCAP is detected in different types of tumors, with 1.3-fold (P = 0.03) in the brain (20.9% [n = 24] and 16.4% [n = 12], respectively; P = 0.03).


