
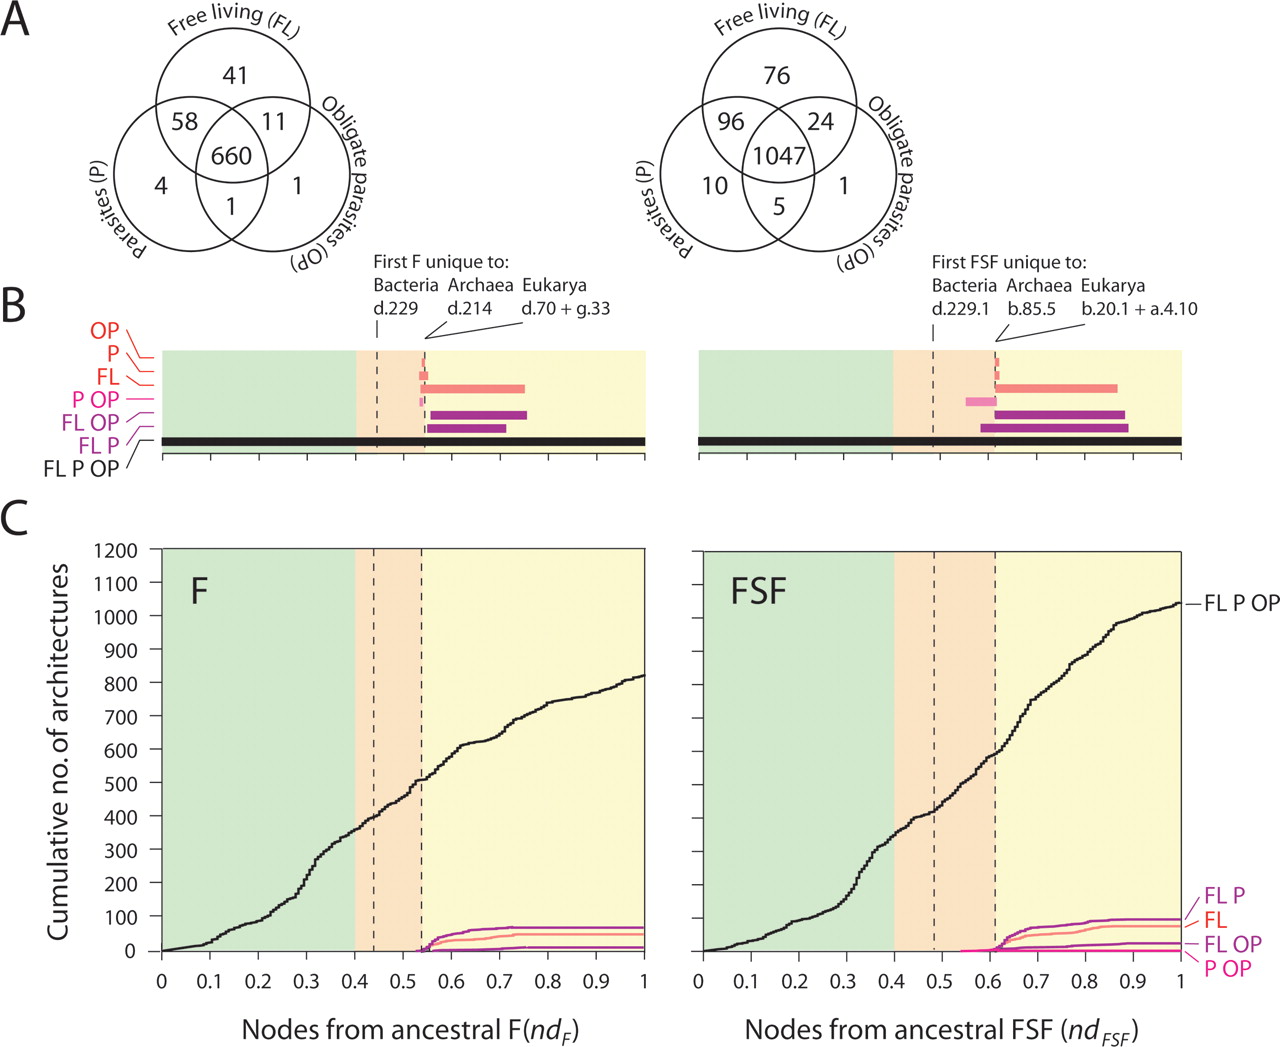
Figure 5.
Cumulative frequency distribution of F (left) and FSF (right) along the trees of architectures that are unique or shared by organisms with (FL) free-living, (P) parasitic, or (OP) obligate parasitic lifestyles. (A) Venn and (B) bar diagrams show the distribution and range of age (nd, number of nodes from the root/total number of nodes in the tree) for architectures within one (FL, P, or OP) or more (FL-P, FL-OP, P-OP, and FL-P-OP) lifestyle categories. (C) Cumulative number of F or FSF architectures against nd.


