
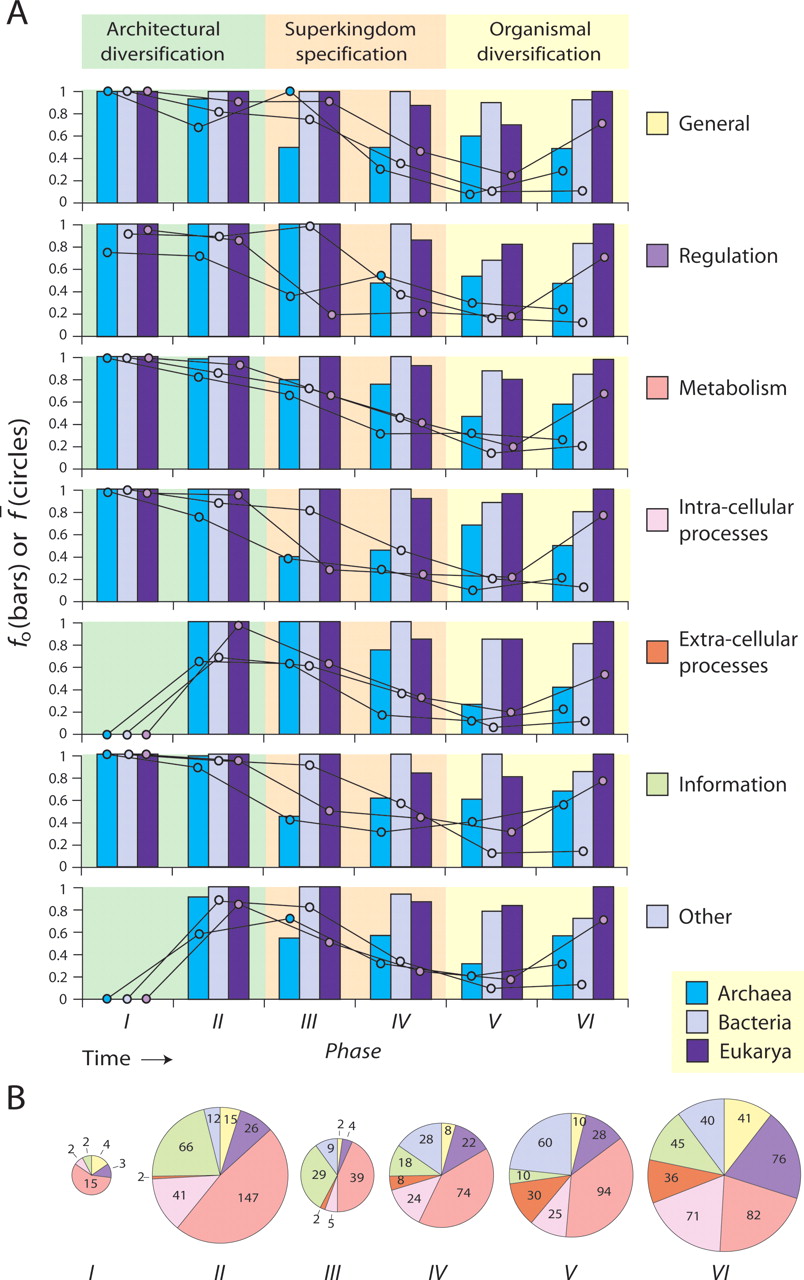
Evolution of biological function along the six phases of the architectural chronology. (A) Bar diagrams describe the fraction of FSF corresponding to each of seven coarse-grained functional categories in each superkingdom relative to their use in all life within a particular evolutionary phase (fo), and circles describe how widely distributed these FSF are among organisms within each superkingdom, as average distribution indices (f). When bars and circles are both high or low, the relative importance of that function is either high or low, respectively—the function present in most FSF is important to most organisms in a superkingdom, or the function present in few FSF is only important to a small organismal subset. When bars are high and circles are low or when bars are low and circles are high, function in most FSF is important to small organismal subsets or function in few FSF is important to most organisms, respectively. (B) Pie charts describe FSF distribution in functional categories for every phase. The size of each pie chart is proportional to the number of FSF in each phase. Four uninformative “not annotated” FSF (d.58.45 and e.30.1 of phase V, and a.125.1 and d.46.1 of phase VI) were not included in the analysis.


