
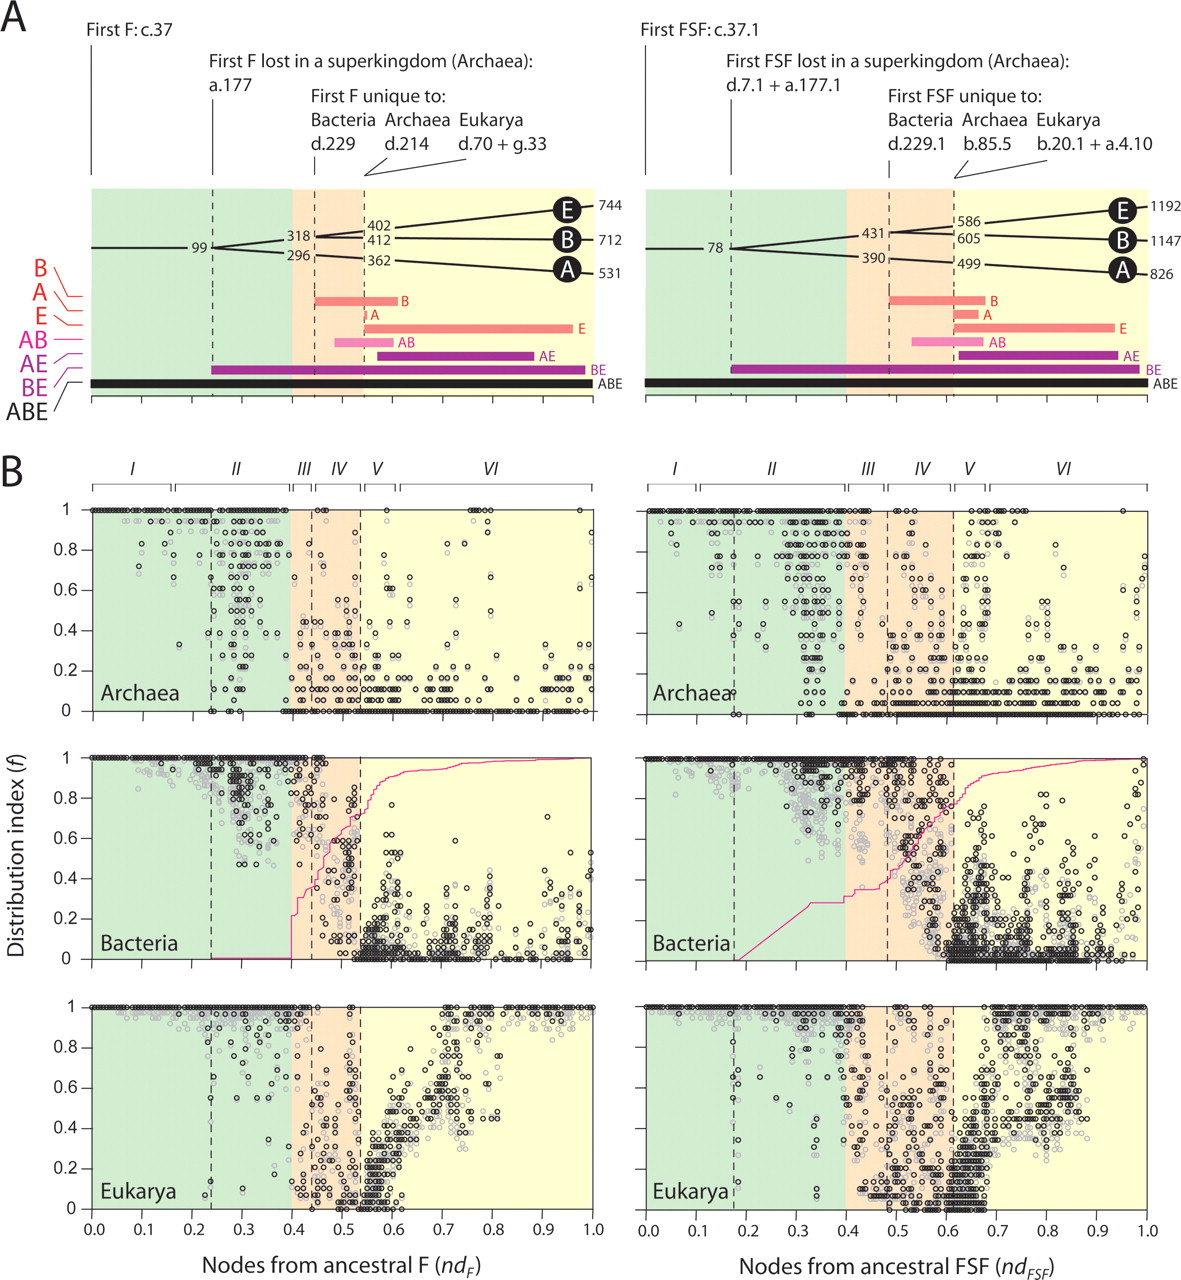
Six phases in the evolutionary timeline of the protein world based on distribution of F (left) and FSF (right) within the three superkingdoms of life. (A) Bar diagrams display ranges of age (nd) for architectures unique to superkingdoms (A, B, or E) or shared by two (AB, BE, or AE) or all (ABE) superkingdoms. Trees describe global most-parsimonious scenarios for organismal diversification of proteomes based on architectural distribution patterns. Numbers indicate the size of architectural repertoires in A, B, and E lineages at the corresponding nd values. The horizontal scale is as in B. (B) Distribution index (f) of F and FSF within the three superkingdoms for (gray) all organisms or (black) free living only against the age of the individual architectures. (Light green) Structural diversification; (salmon) superkingdom specification; (yellow) organismal diversification epochs. Roman numerals indicate the evolutionary phases of the protein world described in the text. (Red lines) Cumulative loss of BE architectures (number of architectures absent in each organism, summated over organisms, and integrated over nd); the ordinate is in logarithmic scale with units not displayed; the abscissa matches nd values.


