
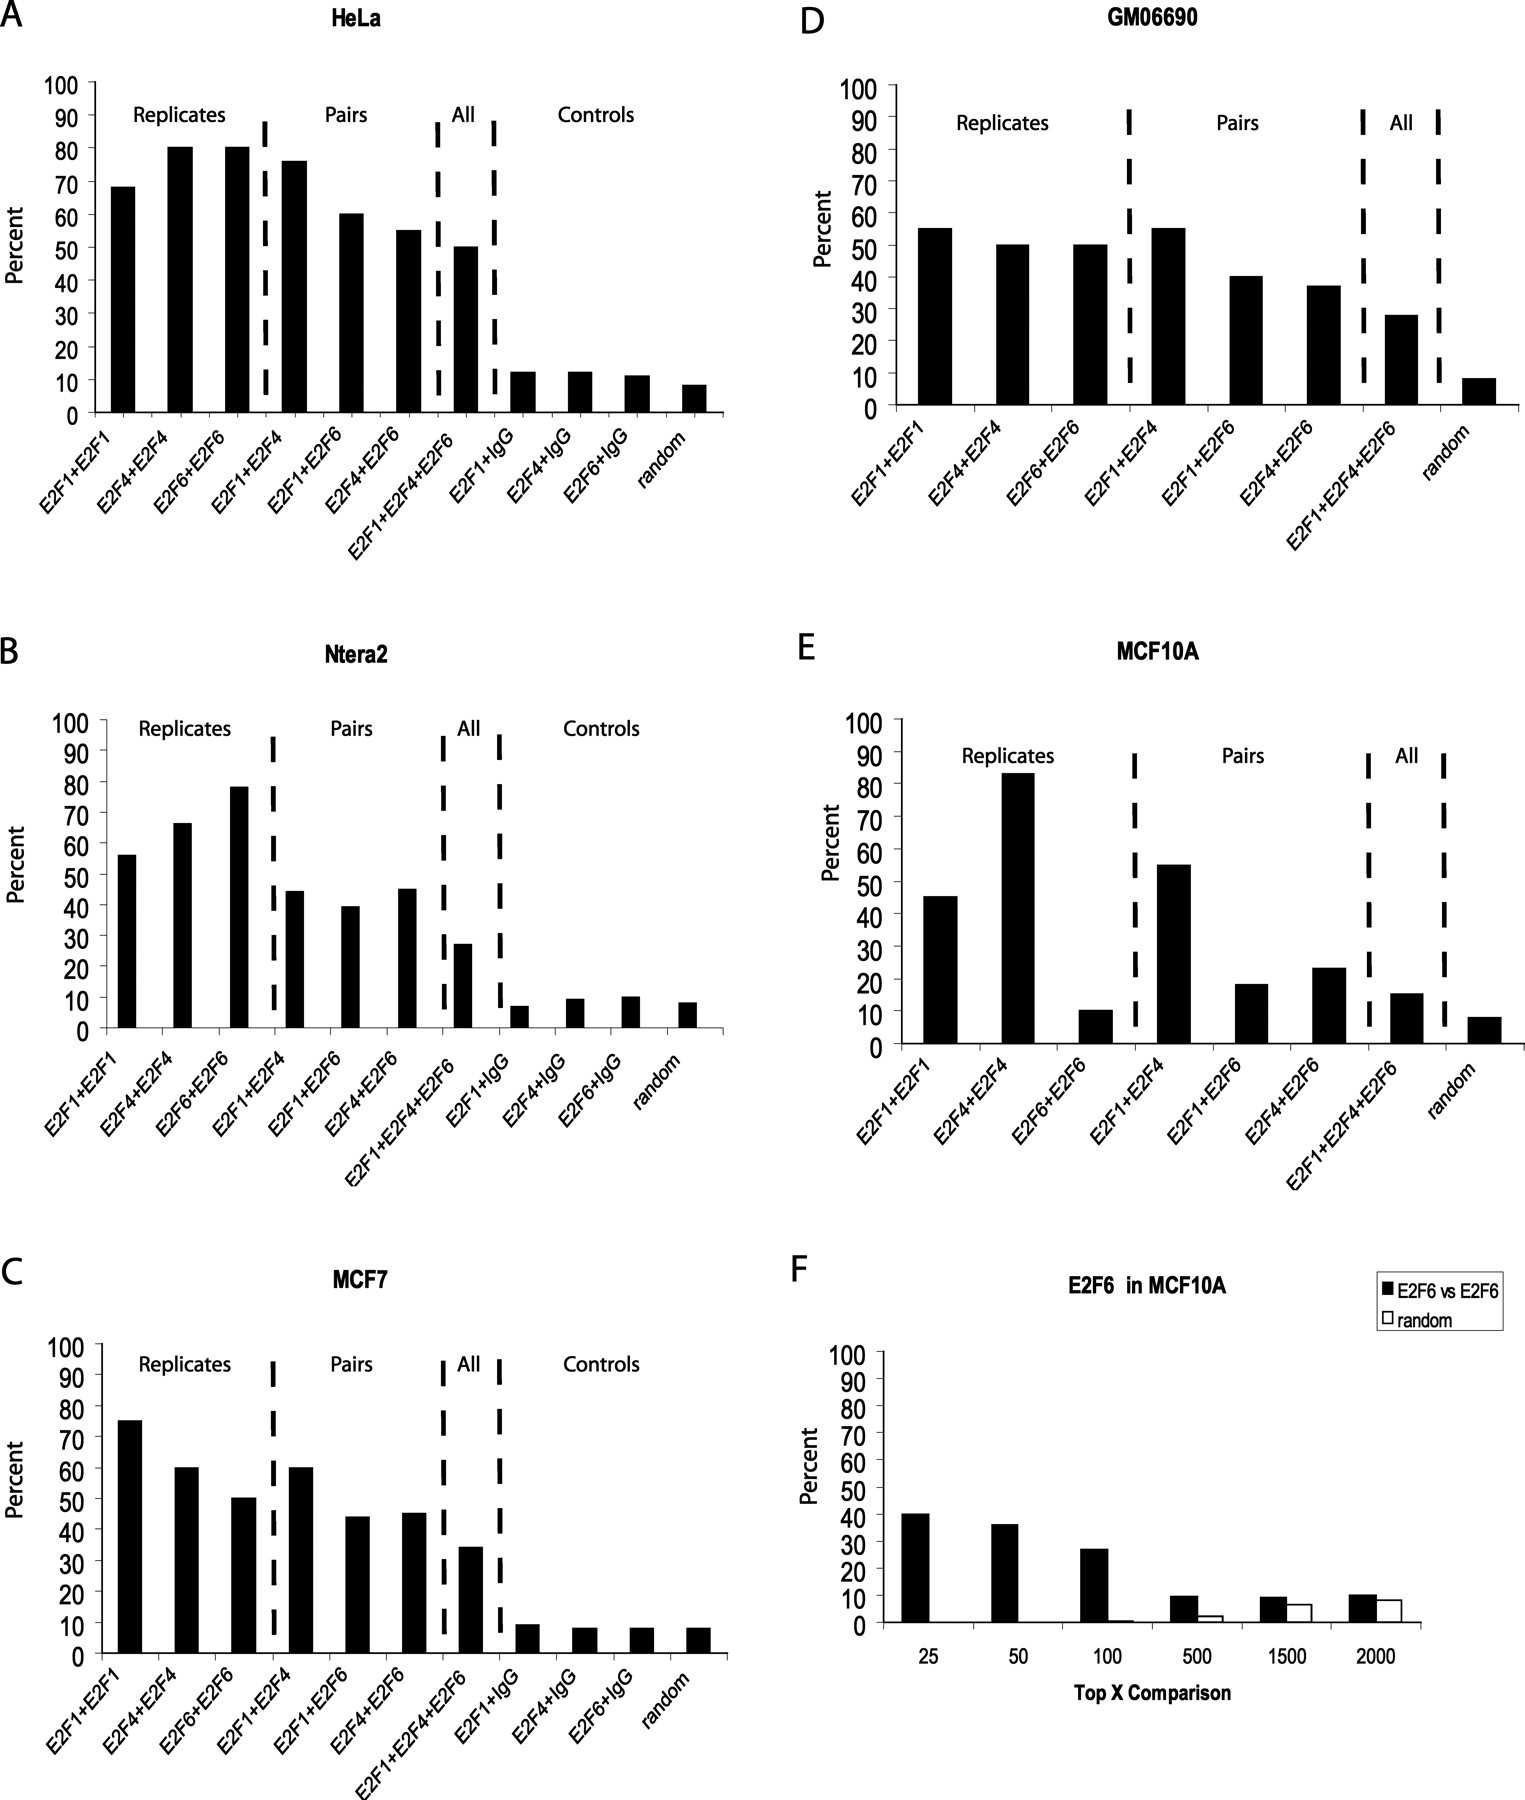
E2Fs bind to a similar set of target genes in a given cell type. Pairwise comparisons of the percentage of promoters in common in the sets of top 2000 ranked promoters in E2F1, E2F4, and E2F6 ChIP–chip assays in HeLa (A), Ntera2 (B), MCF7 (C), GM06990 (D), and MCF10A (E) cells. In A–C the overlap in top-ranked promoters after comparison of E2F arrays to IgG arrays is also shown. In A–E, the number expected by random chance to be in common when comparing the data sets is also shown. In F, the percentages of promoters in common in two independent E2F6 ChIP–chip assays in the set of the top 25, 50, 100, 500, 1500, and 2000 ranked promoters is shown for MCF10A cells. Also shown in F is the number expected by random chance to be in common when comparing the various numbers of ranked promoters.


