
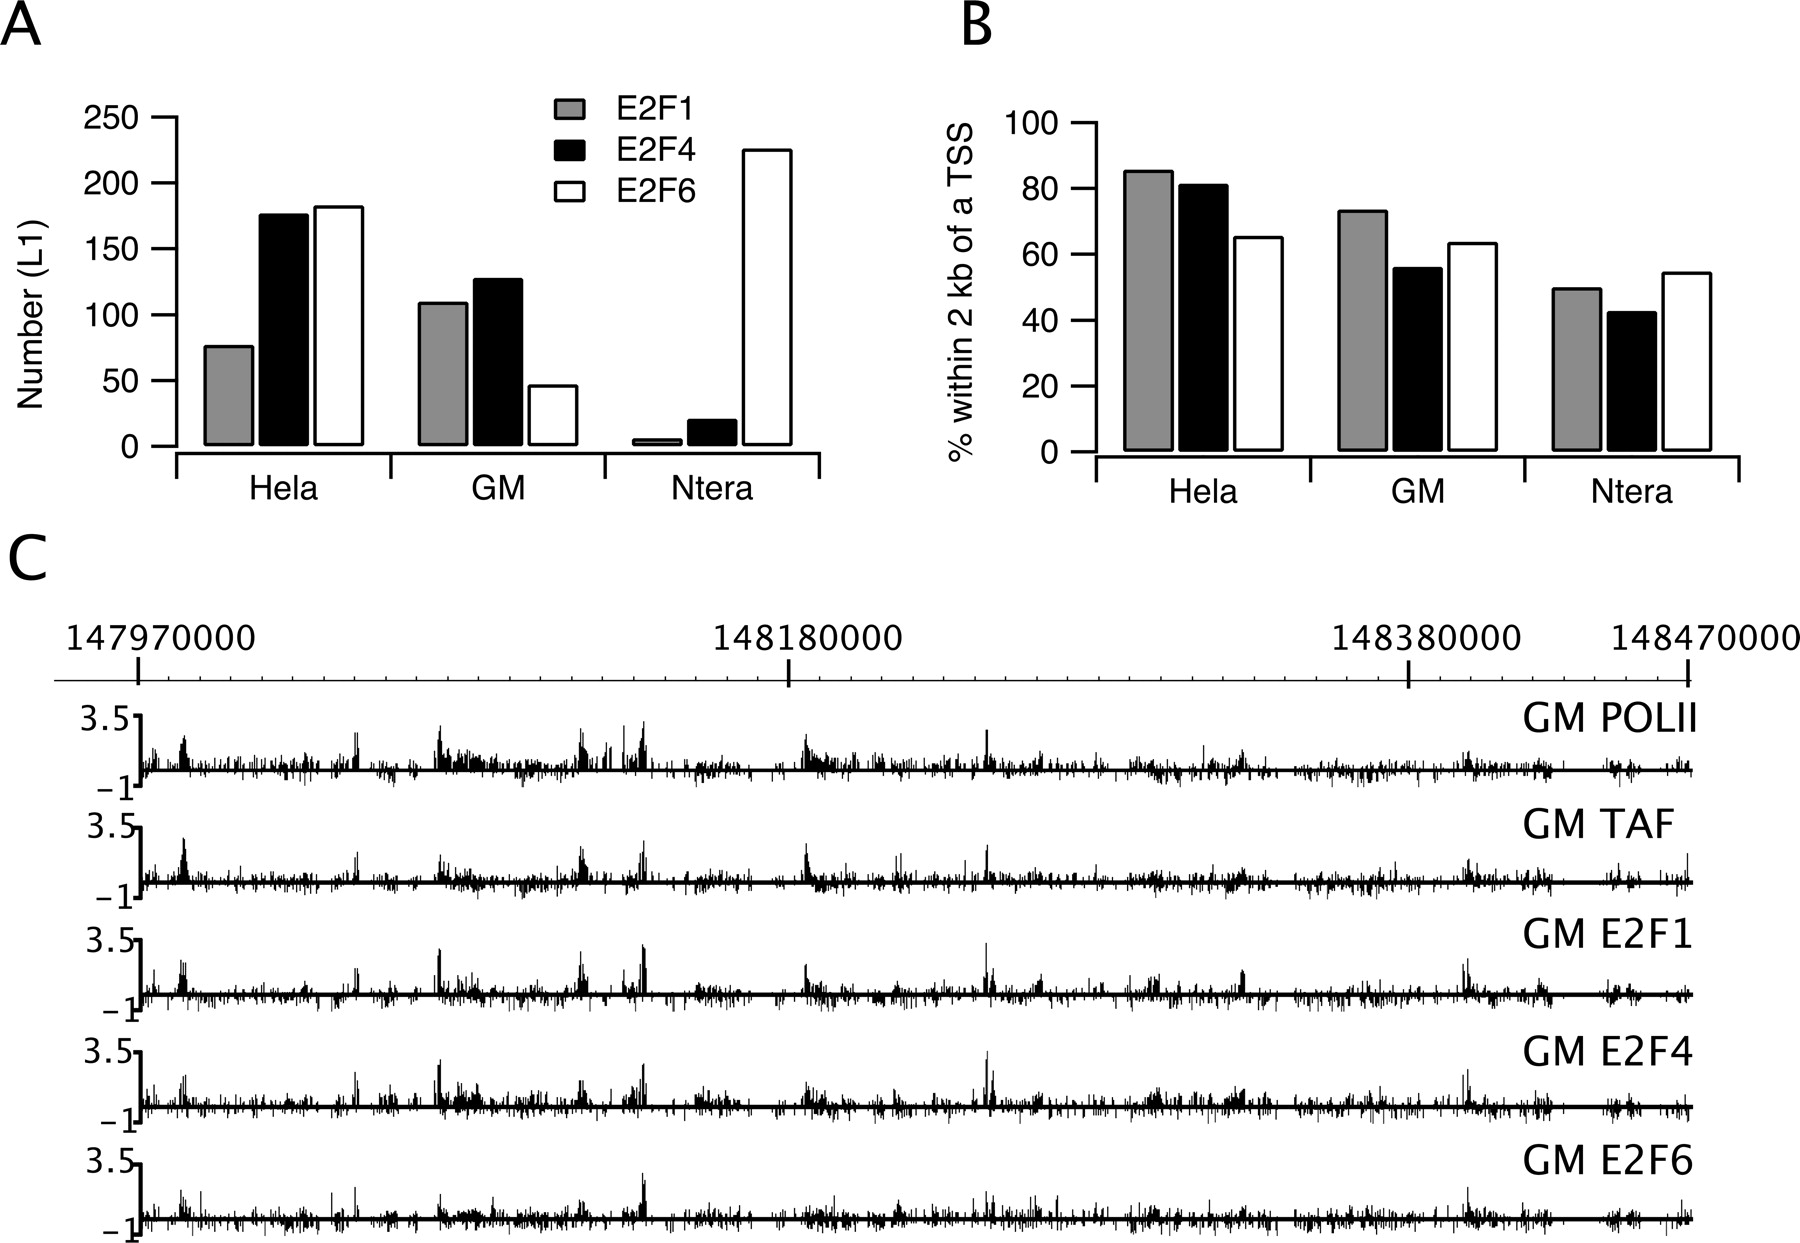
E2F family members bind near start sites in both normal and tumor cells. ChIP–chip assays were performed using three independent cultures for each of three different cell types (HeLa, GM06990, or Ntera2 cells) and antibodies to E2F1, E2F4, or E2F6. The samples were analyzed on ENCODE arrays (see Methods) and peaks were called for each array using the L1 category of peaks called by the Tamalpais program (Bieda et al. 2006). A binding site was identified if a site was enriched in at least two of the biological replicate experiments for a particular antibody/cell type combination. (A) Shown are the number of E2F1, E2F4, or E2F6 binding sites identified in the ENCODE regions for the three different cell types. Because the E2Fs bind to many of the same regions, the total number of E2F binding sites for a given cell type is less than the sum of the E2F1, E2F4, and E2F6 sites; there were 270 distinct E2F binding sites for HeLa cells, 187 for GM06990 cells, and 232 for Ntera2 cells (see Supplemental Table S2). (B) Shown is the % of each set of E2F1, E2F4, and E2F6 binding sites for each cell type that is within 2 kb of a transcription start site. (C) ChIP–chip binding patterns for a region of chromosome 1 are shown for RNA polymerase II (POLII), TAF1 (TAF), E2F1, E2F4, and E2F6 in GM06990 (GM) cells. The Y-axis indicates fold enrichment of the ChIP sample.


