
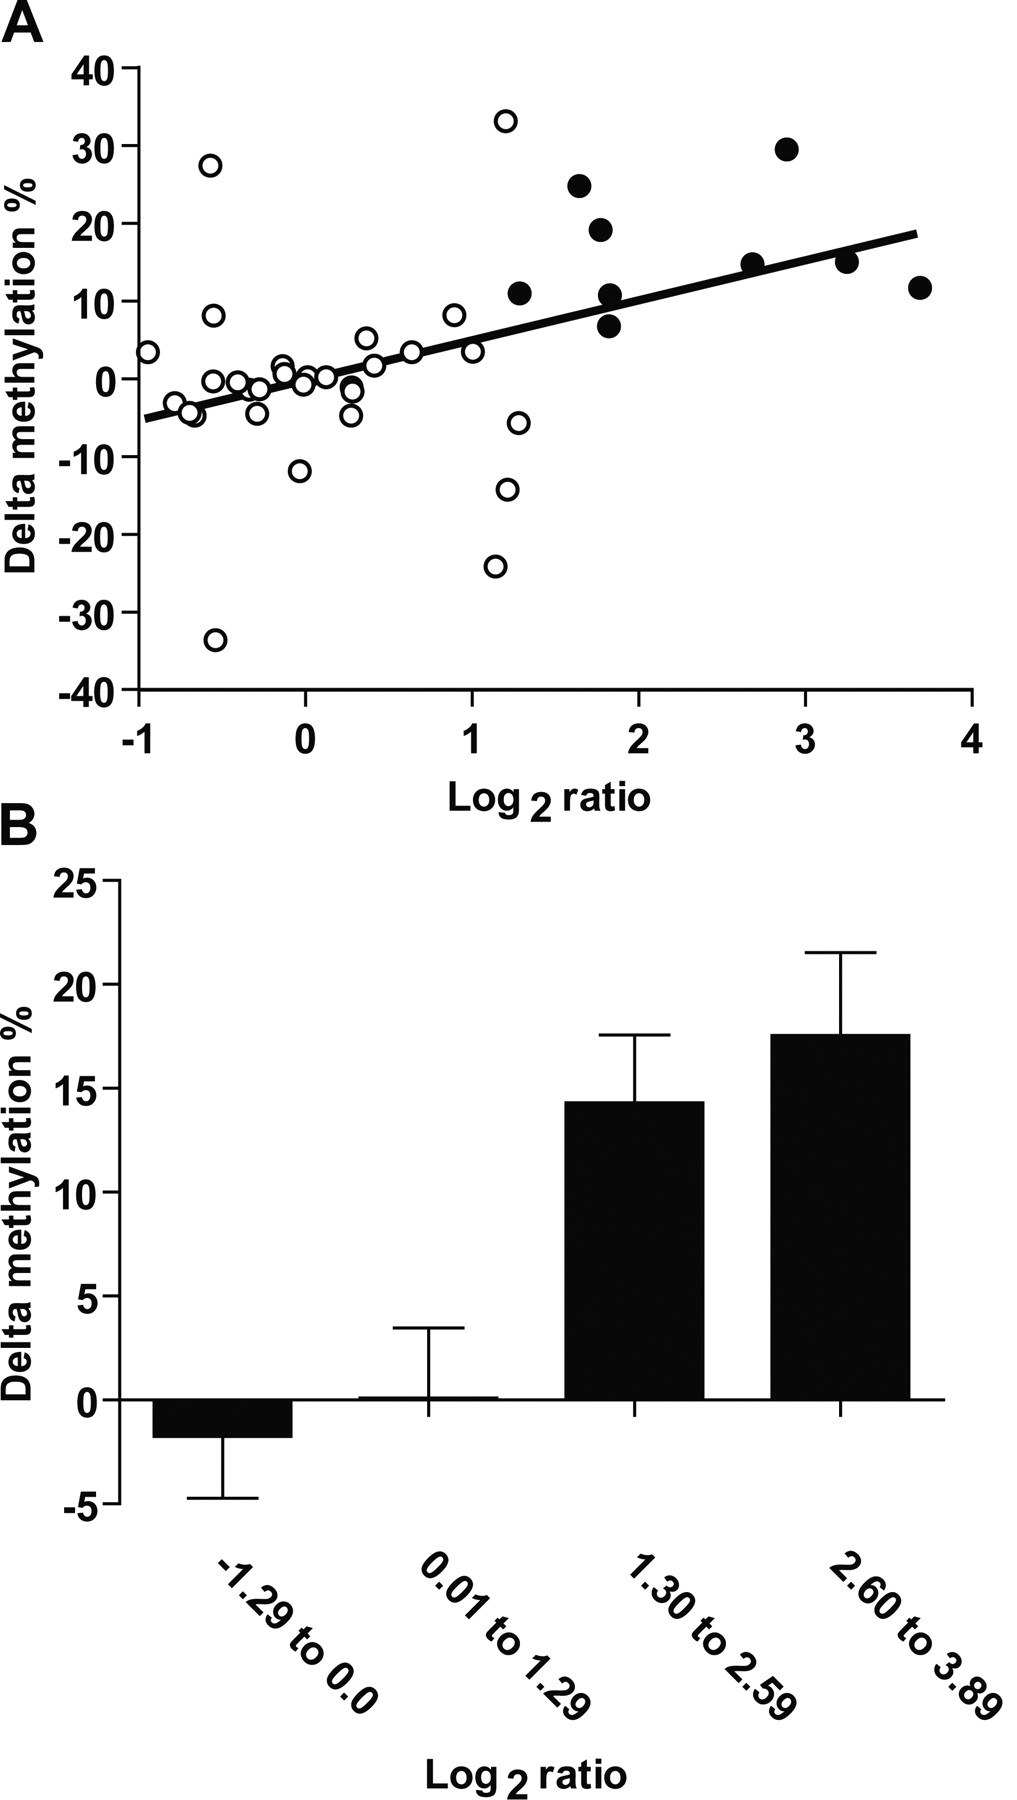
Validation of methylation status of selected genes in primary colorectal carcinomas. (A) Correlation between delta methylation (methylation in tumor minus methylation in adjacent normal) and log2 ratio for four genes investigated by bisulfite-PCR and pyrosequencing. (White circles) Genes with lower methylation in tumor compared to normal samples (log2 ratio < 1.3) according to MCAM; (black circles) hypermethylated genes according this technique. (B) Average delta methylation per log2 ratio. (Bar graphic) The average delta methylation of samples in the same log2 ratio quartile window. Note that the difference in methylation between tested (colon tumor) and control (normal colon) increases with log2 ratio deviation from zero, revealing the semiquantitative nature of the MCAM measurements.


