
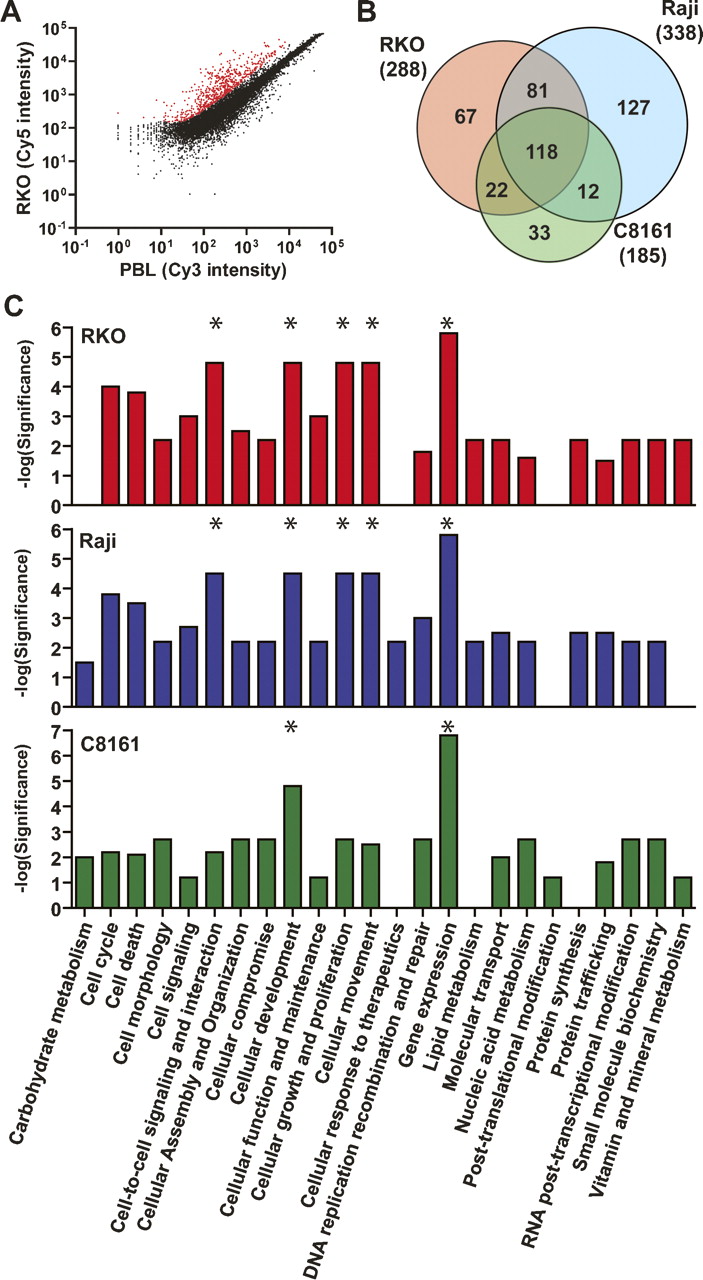
Detection of DNA methylation by MCAM. (A) Scatterplot of Cy5 versus Cy3 intensity values for each probe showing the segregation of methylated (red spots) from unmethylated (black spots) in the colon cancer cell line RKO compared to normal peripheral blood lymphocytes. (B) Venn diagram representing the overlap and differences in methylated probes for the cancer cell lines RKO, Raji, and C8161. Note that a large number of loci are exclusively methylated in each individual cell line. (C) Comparison of significant representation of altered functional categories in cancer cell lines inferred by the presence of methylated genes network. The most significant categories in each cell line are labeled with asterisks (*). Note that “Gene expression” function is affected in all three cell lines, which is because of a large fraction of methylated transcription factors among all identified genes by MCAM.


