
Table 1.
Summary statistics for the risk allele models
Click on table to view larger version.
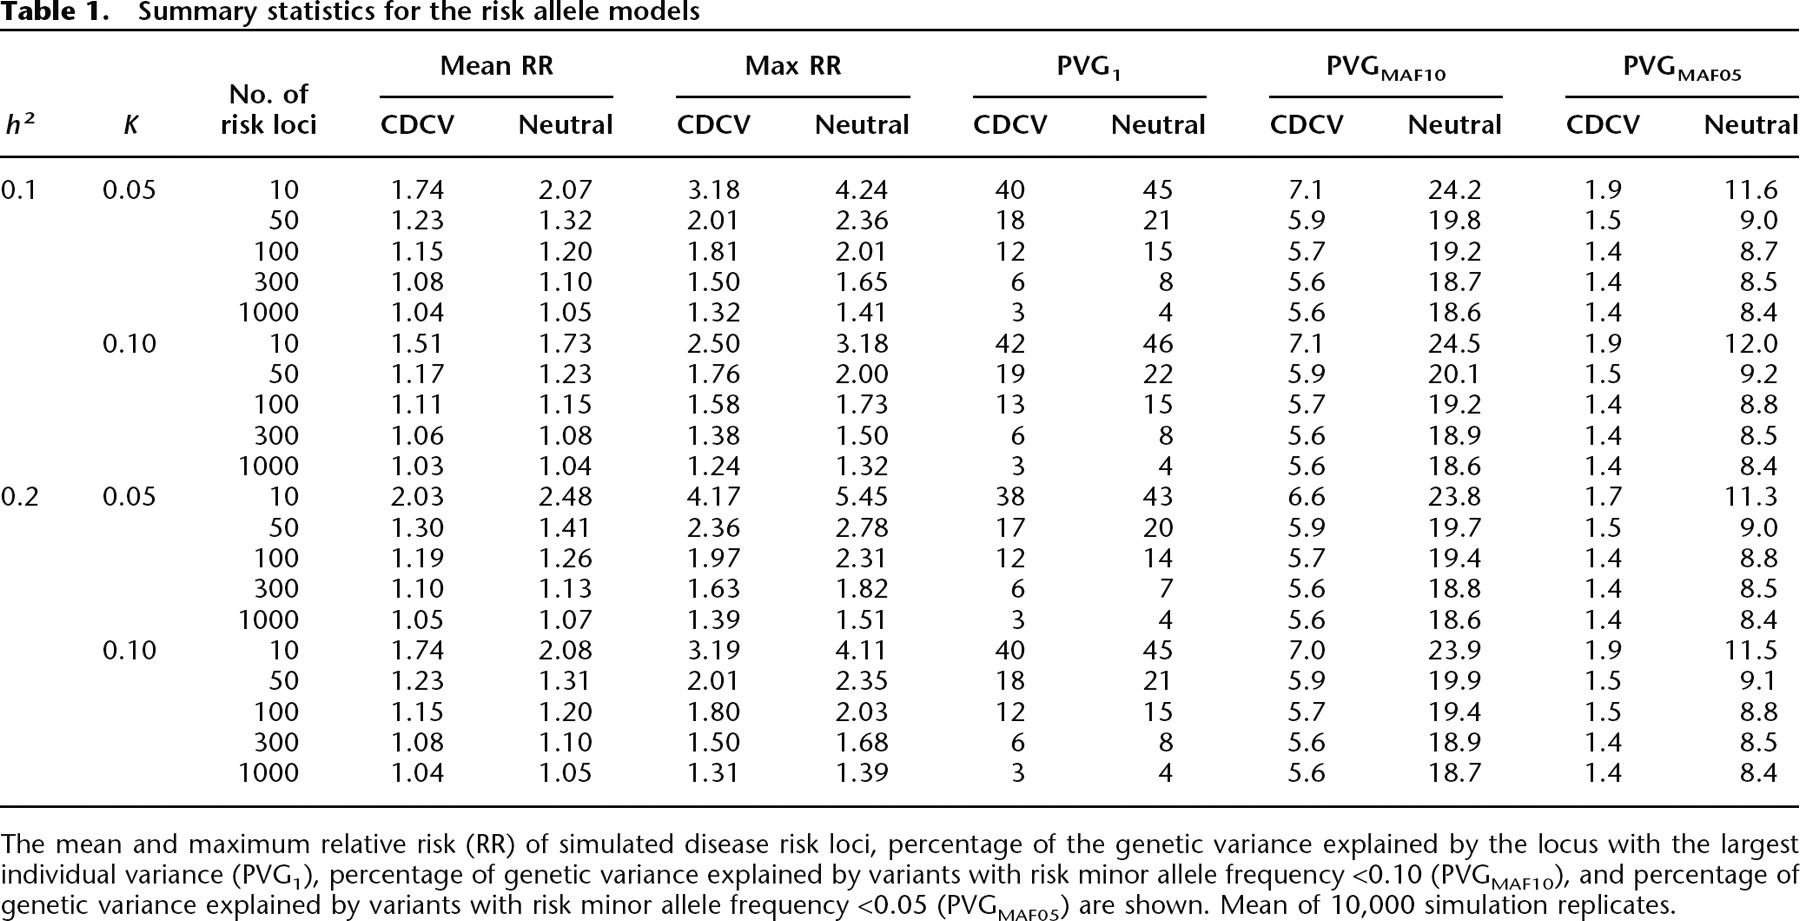
The mean and maximum relative risk (RR) of simulated disease risk loci, percentage of the genetic variance explained by the locus with the largest individual variance (PVG1), percentage of genetic variance explained by variants with risk minor allele frequency <0.10 (PVGMAF10), and percentage of genetic variance explained by variants with risk minor allele frequency <0.05 (PVGMAF05) are shown. Mean of 10,000 simulation replicates.


