
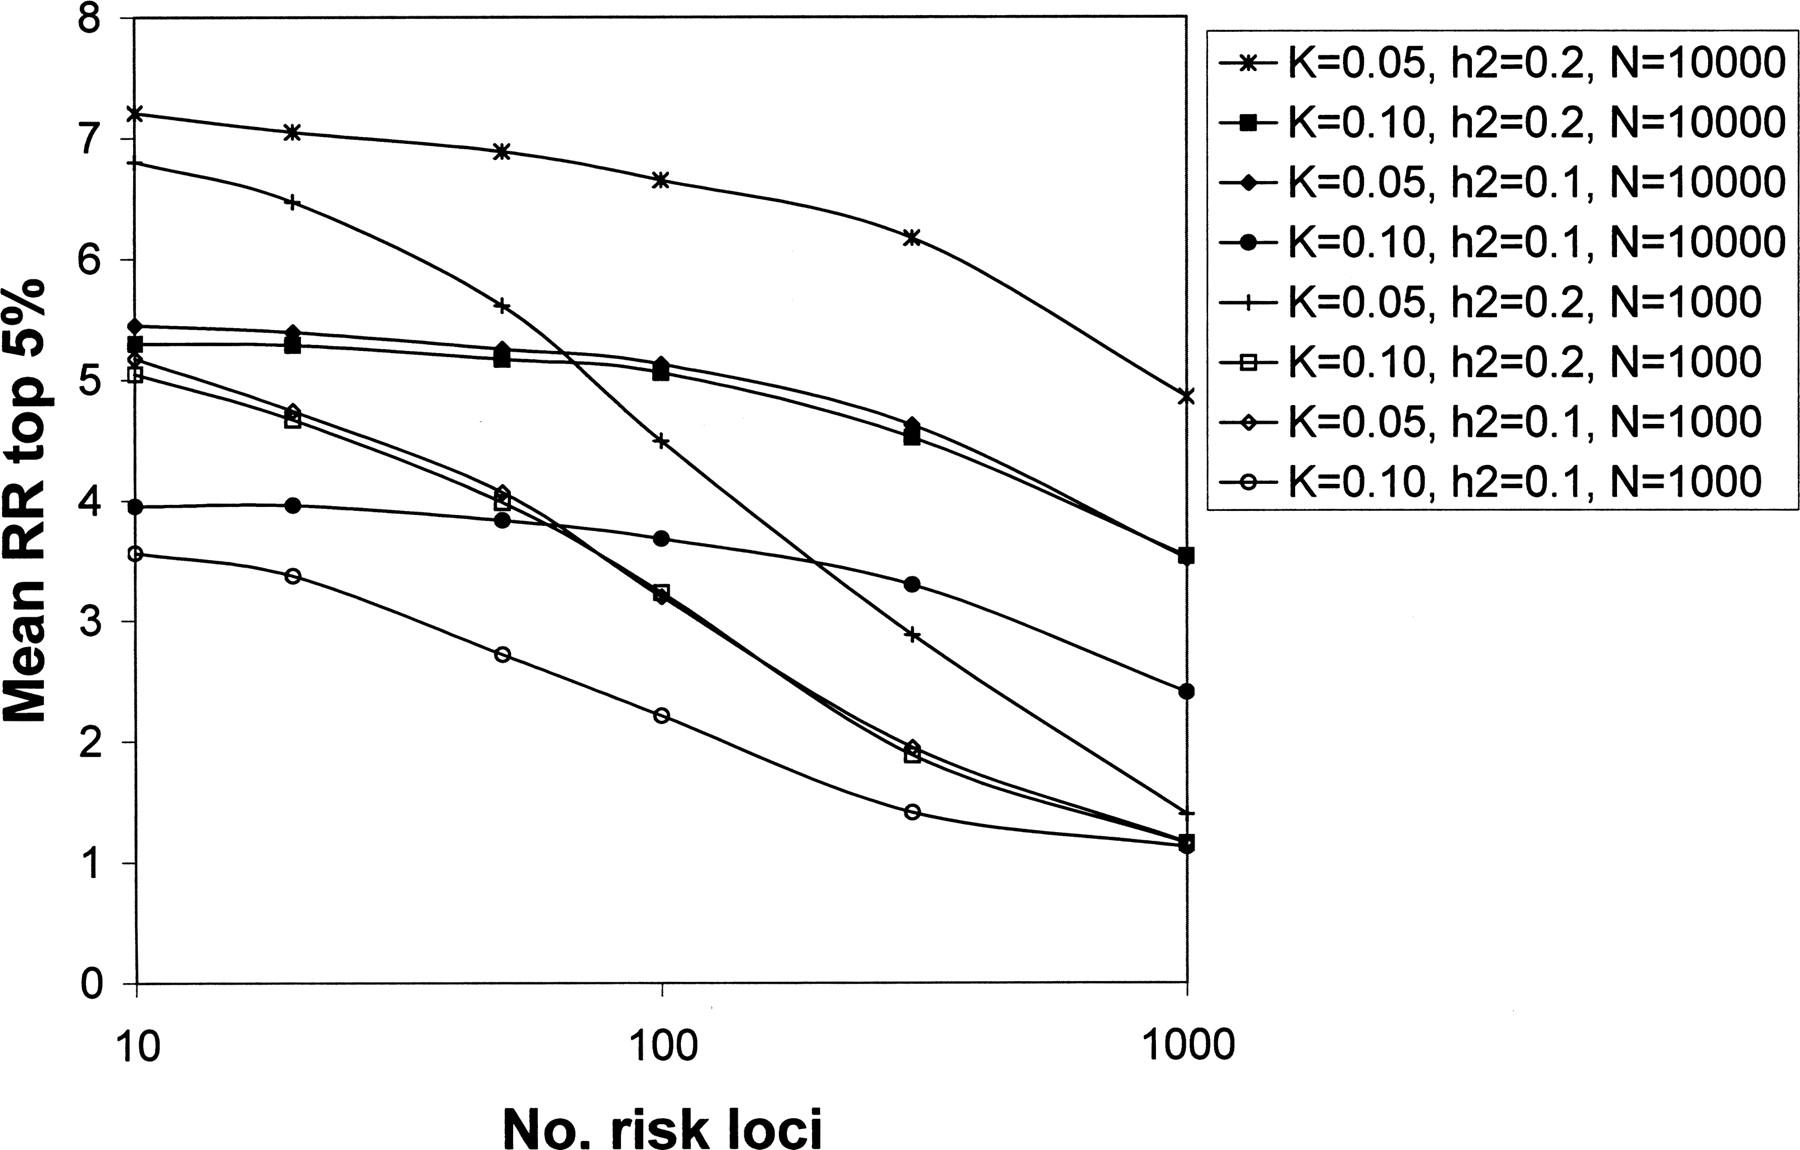
Figure 5.
Relative risk of disease for the estimated top 5% of individuals at risk of a new sample of 1000 people following a case-control study with sample size of N each of cases and controls. A CDCV disease model is assumed with population prevalence (K) and heritability (h2) of the disease. Results for the neutral model were similar. Mean of 100 simulation replicates. The legend lists the data series in their order at 1000 risk loci.


