
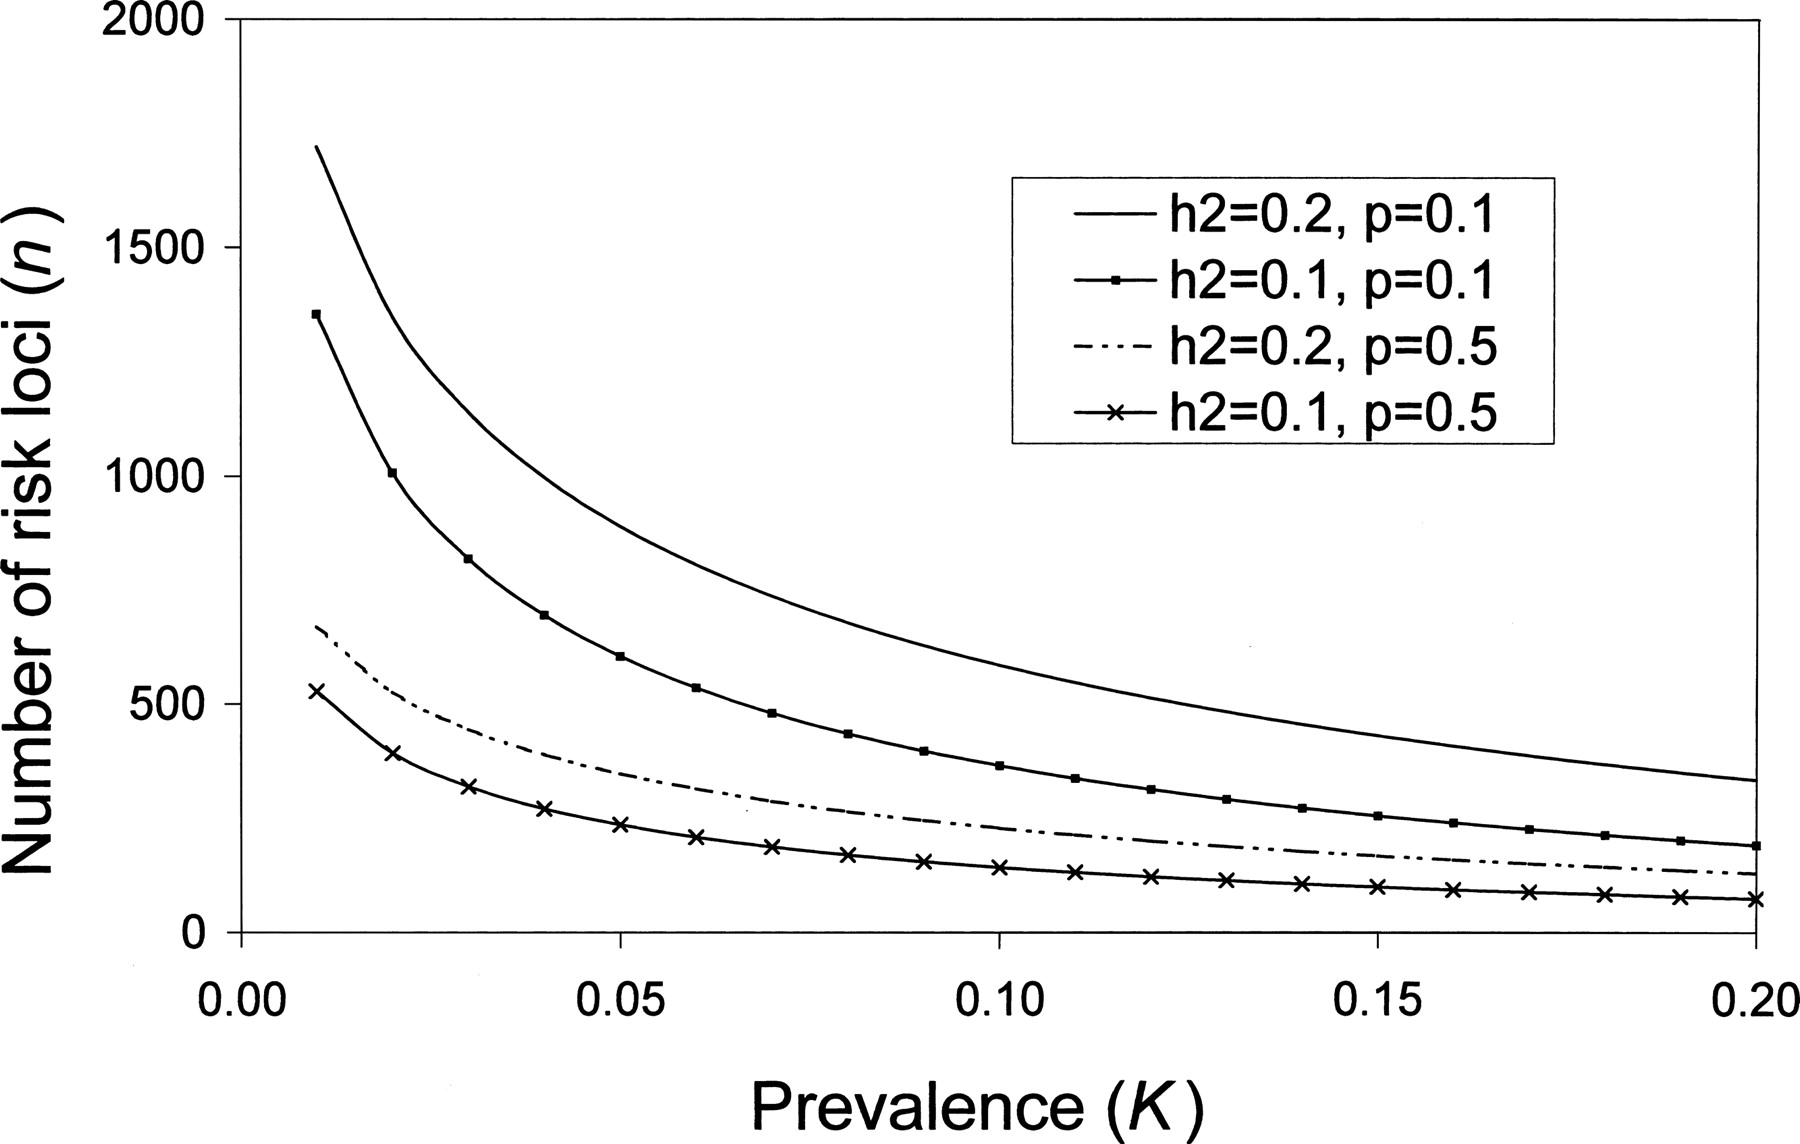
Figure 3.
Relationship between disease prevalence (K) and heritability (h2) on number of risk loci contributing to a disease, assuming a fixed frequency of risk alleles (p) and fixed RR of 1.1 (Equation 3). Based on results from Figure 1, p = 0.1 approximates to the neutral model and p = 0.5 approximates to the CDCV model.


