
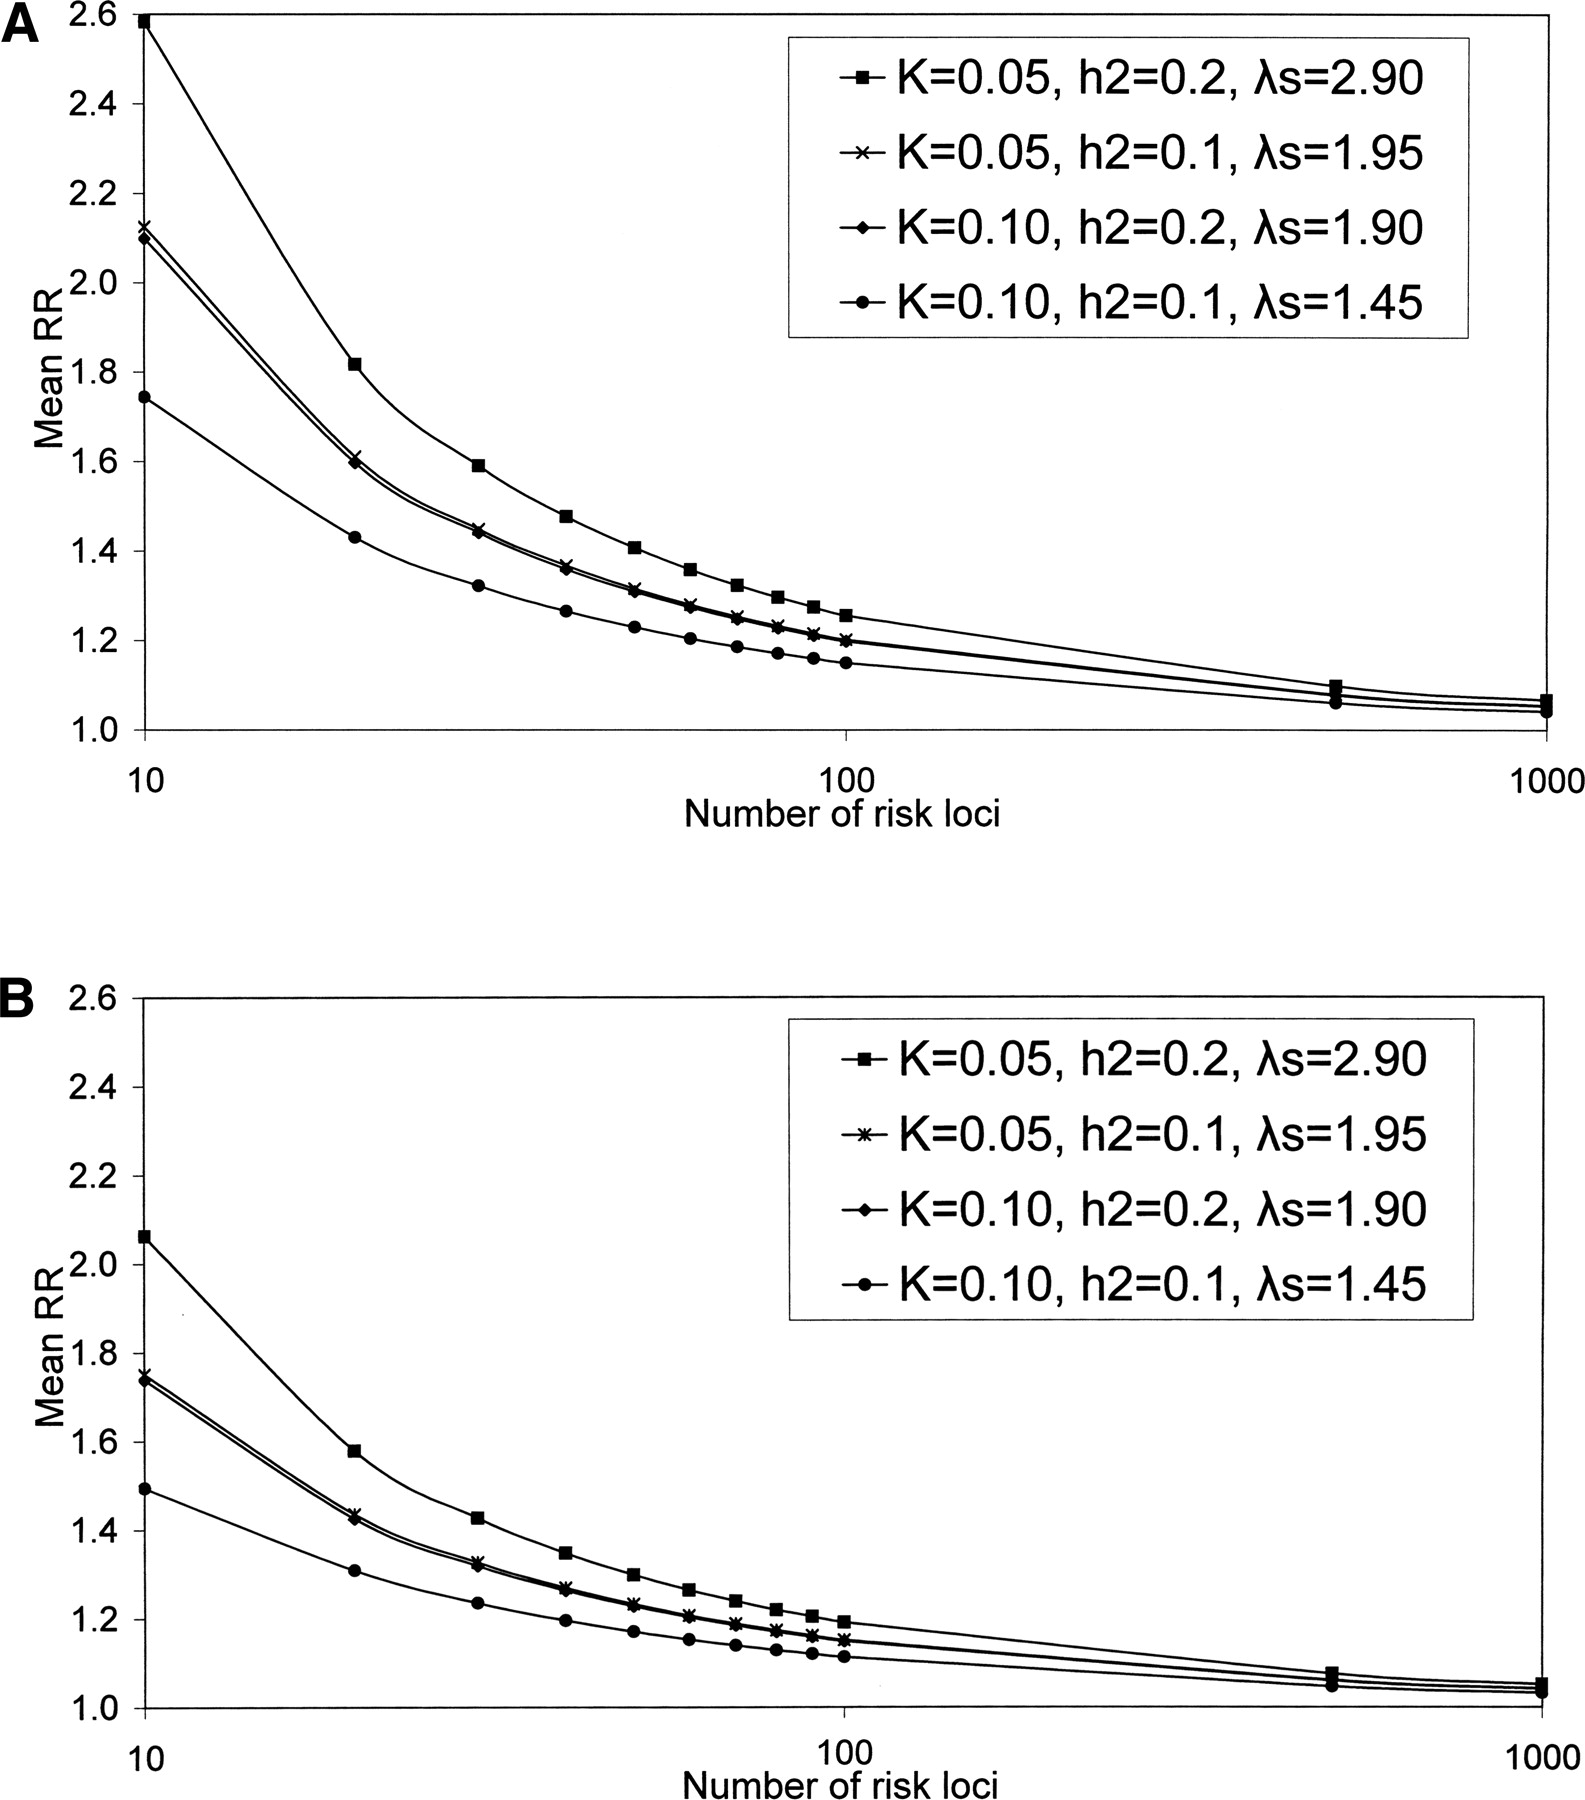
Figure 2.
Relationship between the number of susceptibility or risk loci and their average relative risk (RR) for common disease; K is the population prevalence of the disease; h2 is the heritability on the observed scale; λs is the RR for full-siblings based on the heritability and prevalence parameters. Distribution of effects of risk loci under neutral (A) and CDCV (B) models. The mean RR are the mean of 10,000 simulated samples.


