
Performance of MIMAR when detecting gene flow
Click on table to view larger version.
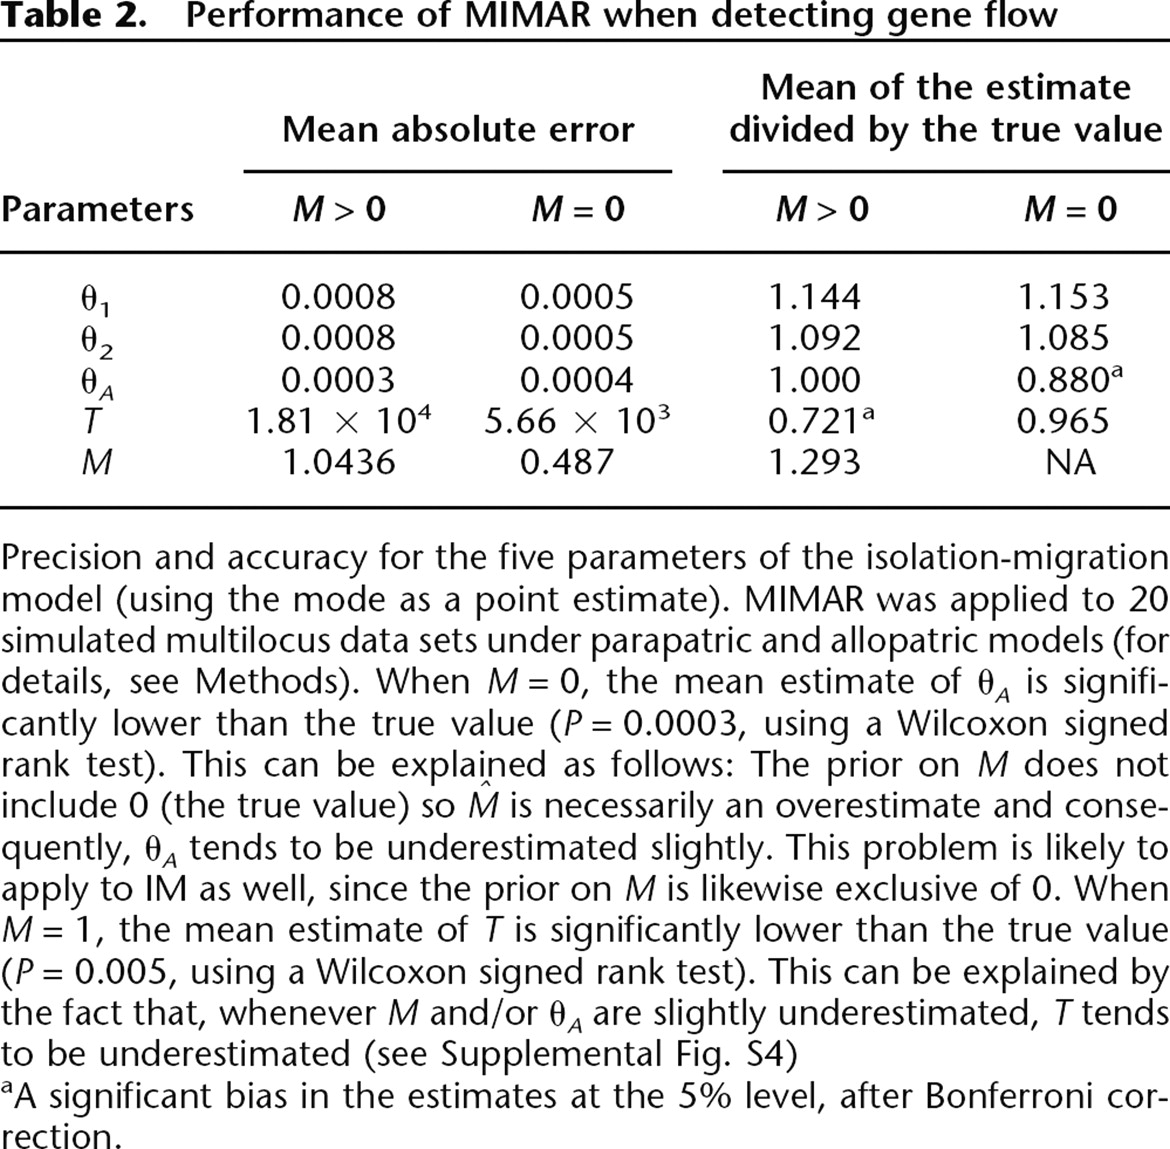
Precision and accuracy for the five parameters of the isolation-migration model (using the mode as a point estimate). MIMAR
was applied to 20 simulated multilocus data sets under parapatric and allopatric models (for details, see Methods). When M = 0, the mean estimate of θA is significantly lower than the true value (P = 0.0003, using a Wilcoxon signed rank test). This can be explained as follows: The prior on M does not include 0 (the true value) so  is necessarily an overestimate and consequently, θA tends to be underestimated slightly. This problem is likely to apply to IM as well, since the prior on M is likewise exclusive of 0. When M = 1, the mean estimate of T is significantly lower than the true value (P = 0.005, using a Wilcoxon signed rank test). This can be explained by the fact that, whenever M and/or θA are slightly underestimated, T tends to be underestimated (see Supplemental Fig. S4)
aA significant bias in the estimates at the 5% level, after Bonferroni correction.


