
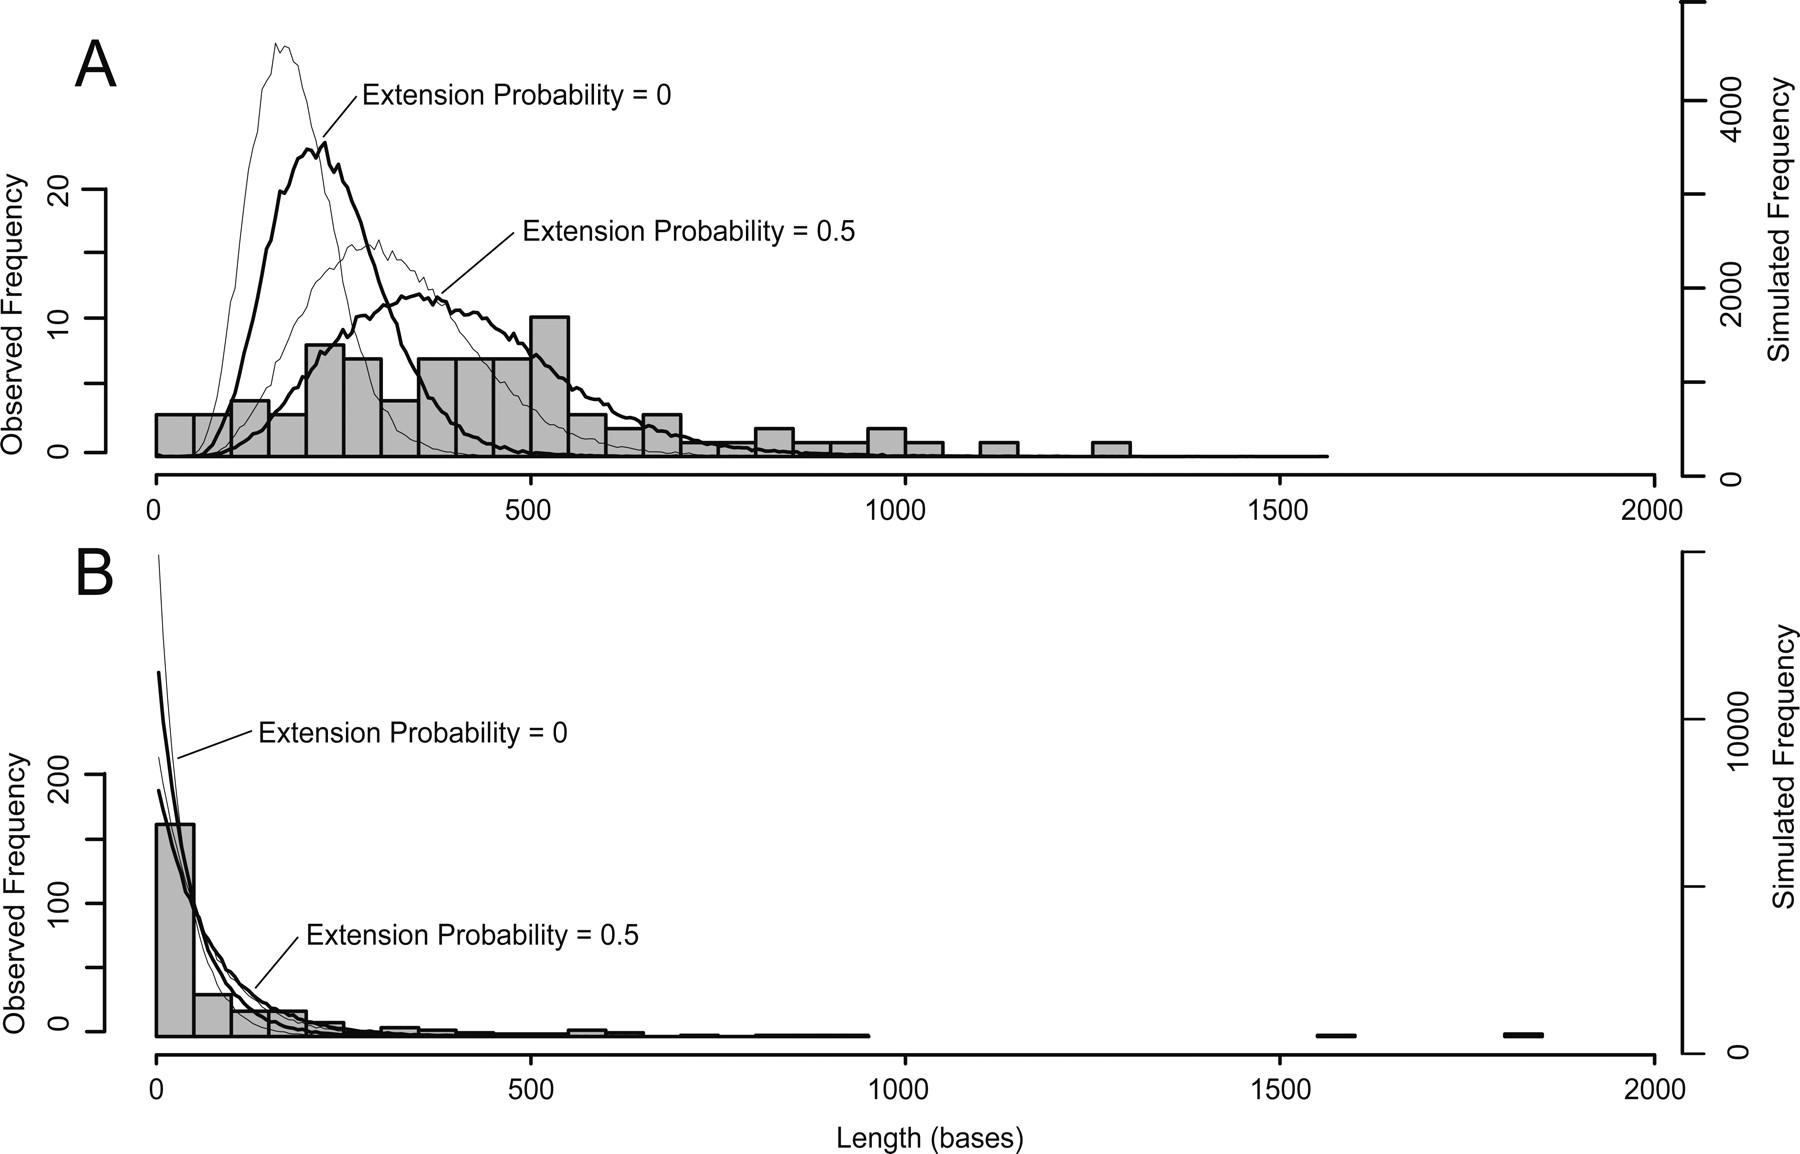
Figure 3.
Frequency distribution of observed overlap lengths and the lengths of ORFs recovered by our simulation. (A) Internal Overlaps: observed and simulated data. (B) Terminal Overlaps: observed and simulated data. Observed overlap lengths are shown as histograms with each value being the mean of a homologous group. Simulated ORF lengths are shown as lines that connect the mid points of a hidden histogram: The thick lines show the +1 frameshift, and the thin line shows the −1 frameshift; the effect of including an extension probability of 0.5 in the simulation is also indicated.


