
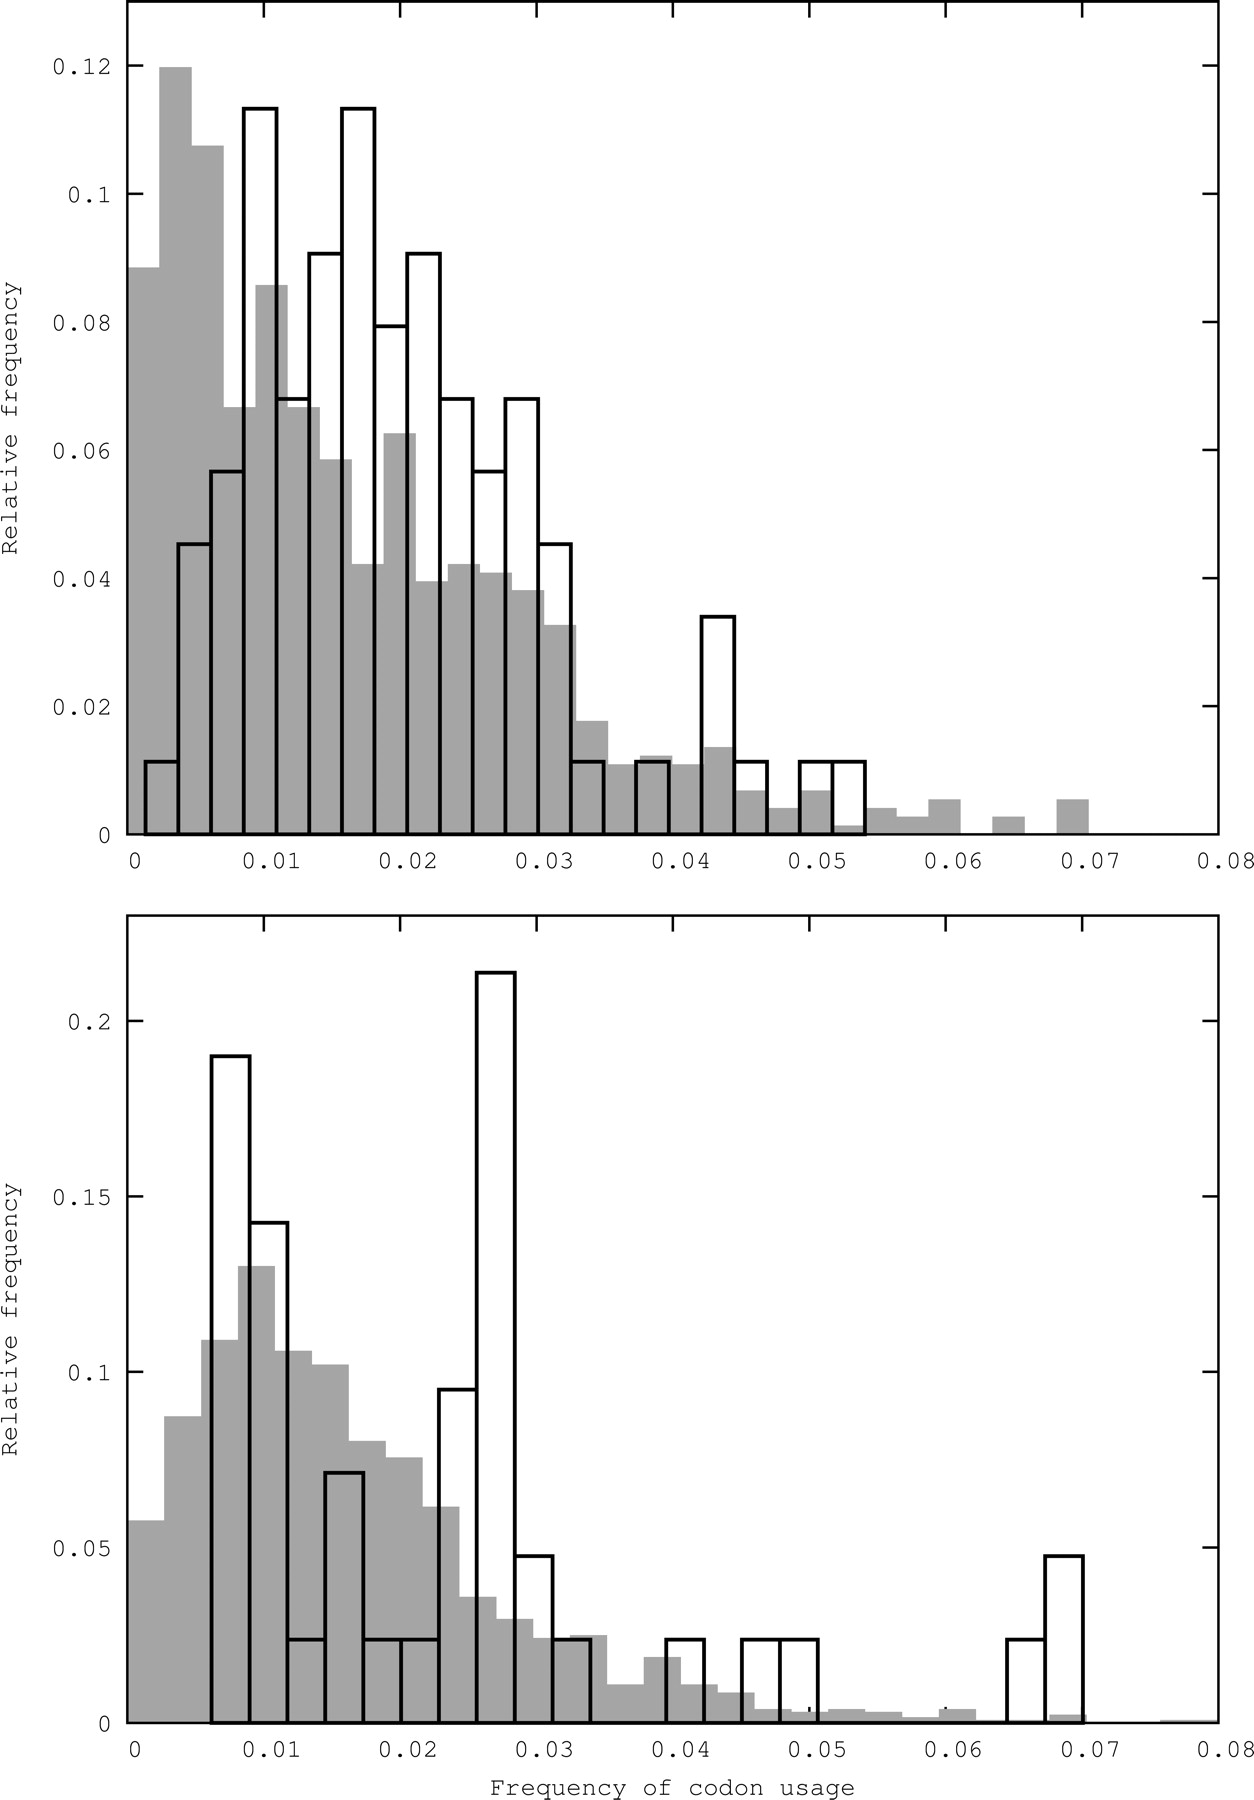
Figure 3.
Distribution of the frequencies of codon usage in virulent phage genomes (top) and temperate phage genomes (bottom). Light-gray filled bars, the distribution of codon frequencies, for all codons; black empty histogram bars, the distribution of codon frequencies, restricted to codons matching a tRNA on the considered phage genome. Note the difference between the distributions in both the virulent and the temperate case.


