
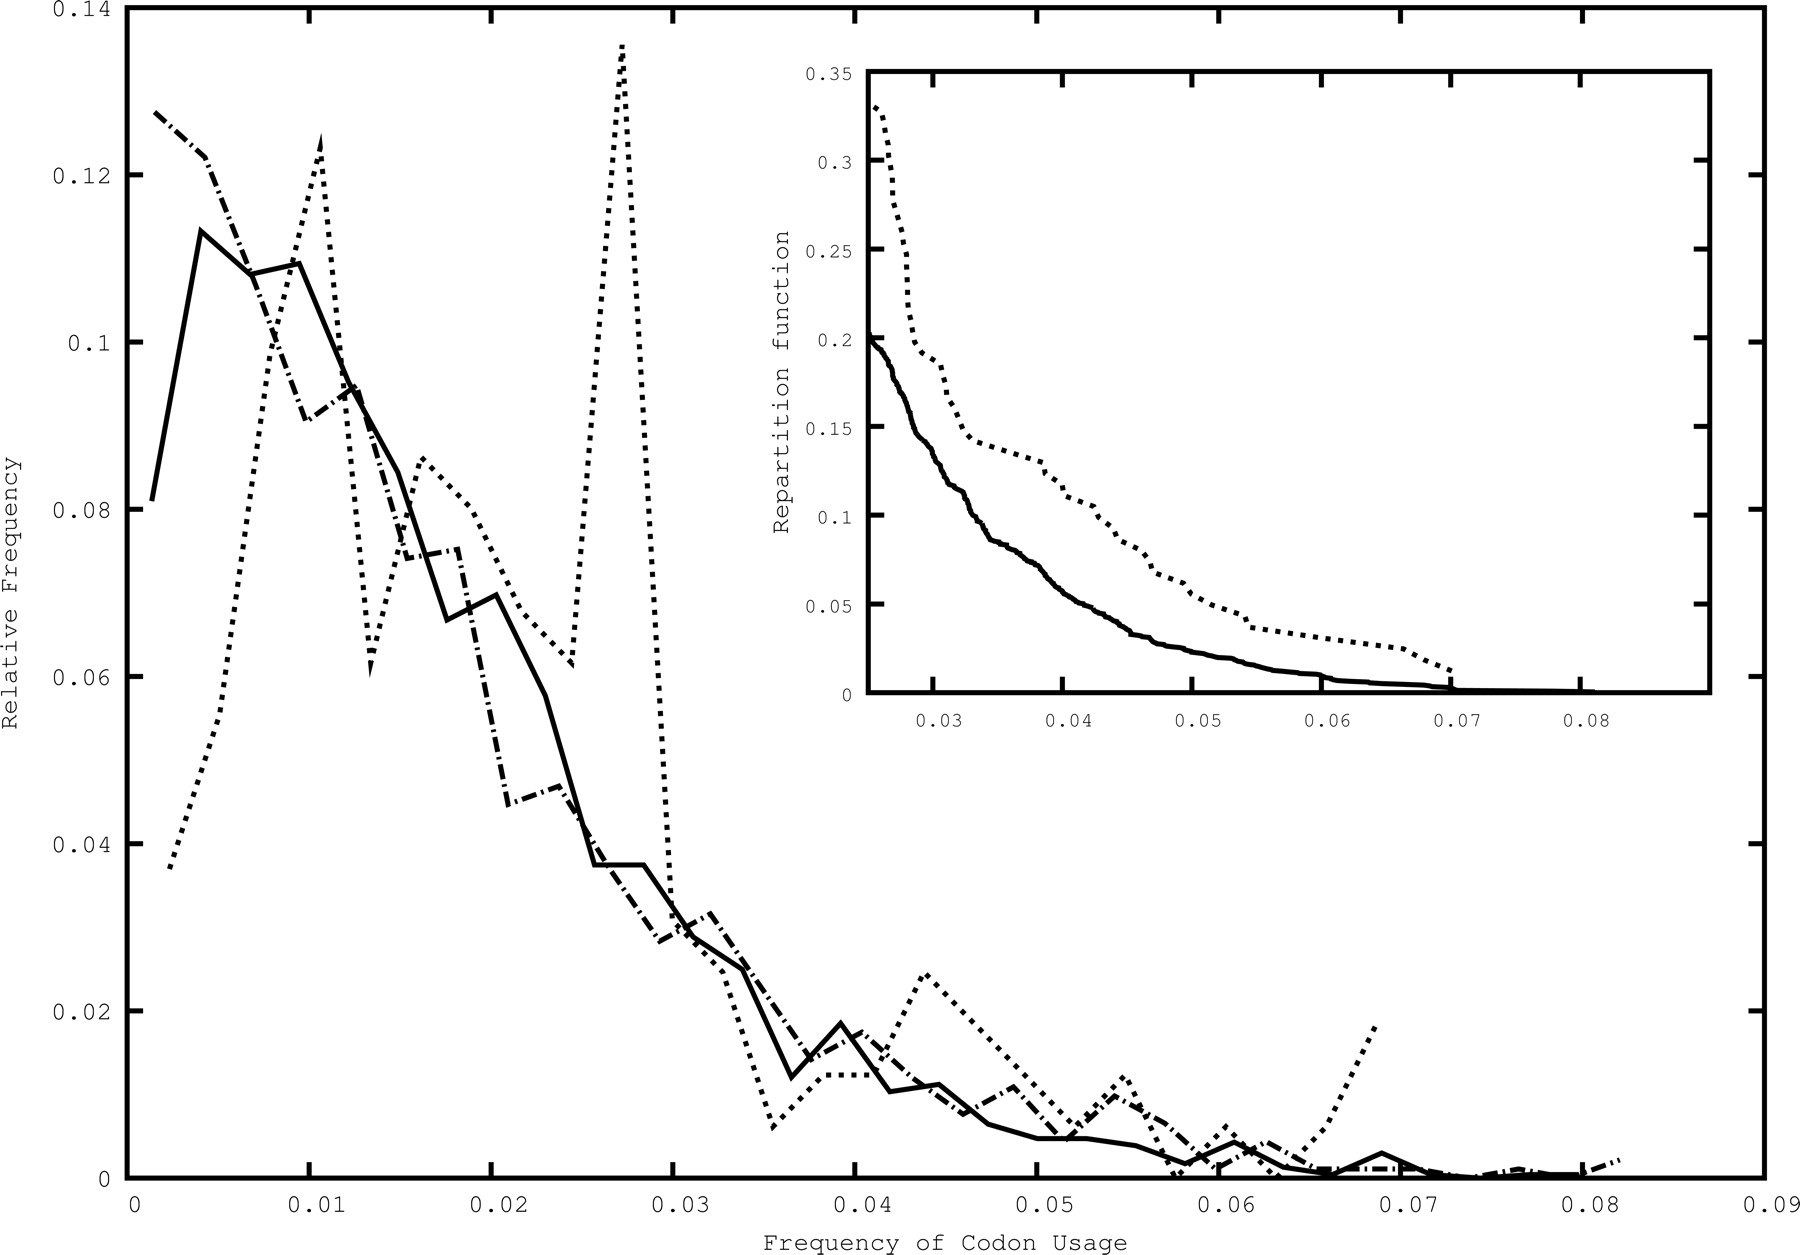
Distribution of the frequencies of codon usage in phage genomes. The solid line is the distribution of codon frequencies; the dotted line, the distribution of codon frequencies, restricted to codons matching a tRNA on the considered phage genome. Note the peak around f = 0.03. The dash–dot line is the frequency distribution for all codons of all hosts. In the inset, the cumulated probability distribution (probability that a random tRNA will have a frequency superior or equal to the one given in abscissa) of the tail of the frequency distributions of the phages for all codons (solid line), and only the ones matching a tRNA (dotted line). Note the difference, indicating an excess of tRNAs matching high-frequency codons in phages.


