
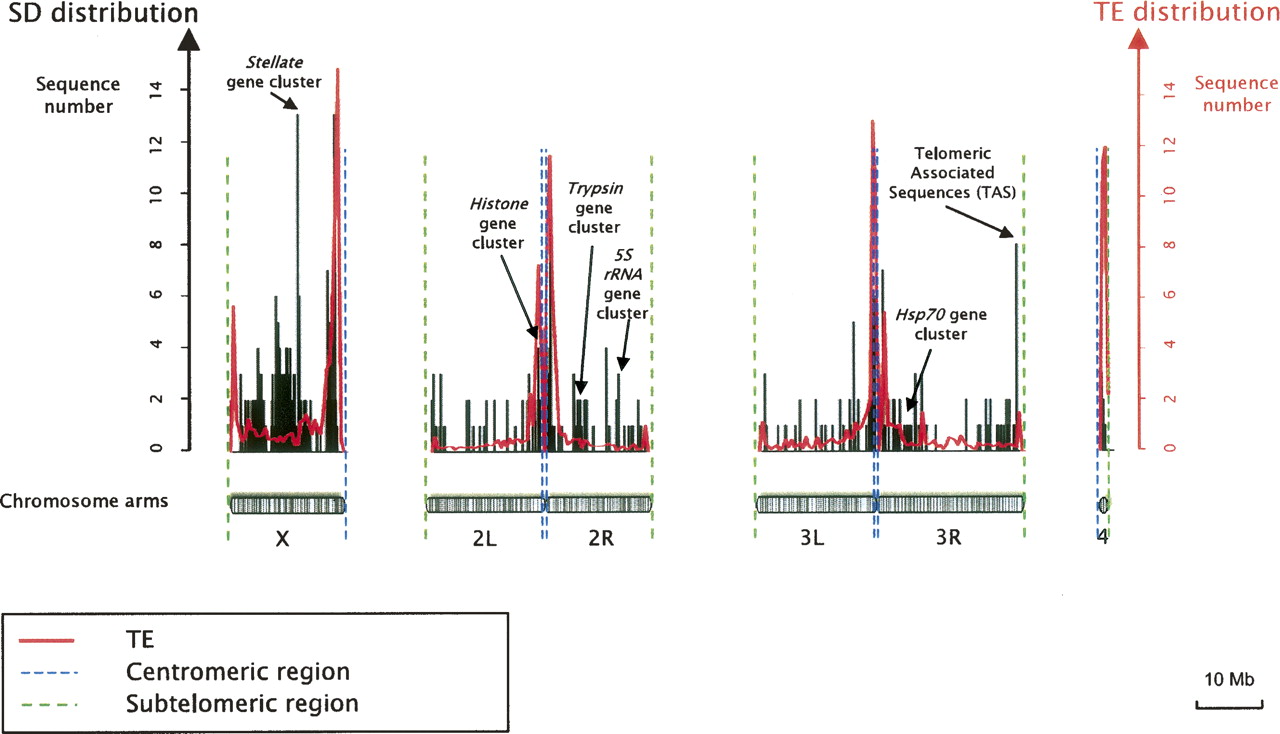
Figure 3.
Chromosomal distribution of detected SDs. SD distribution corresponds to black bars. The red line corresponds to TE distribution along the chromosomes. Blue and green dashed lines indicate centromeric and subtelomeric regions, respectively. Chromosomes were divided into equal-sized windows of 100 kb.


