
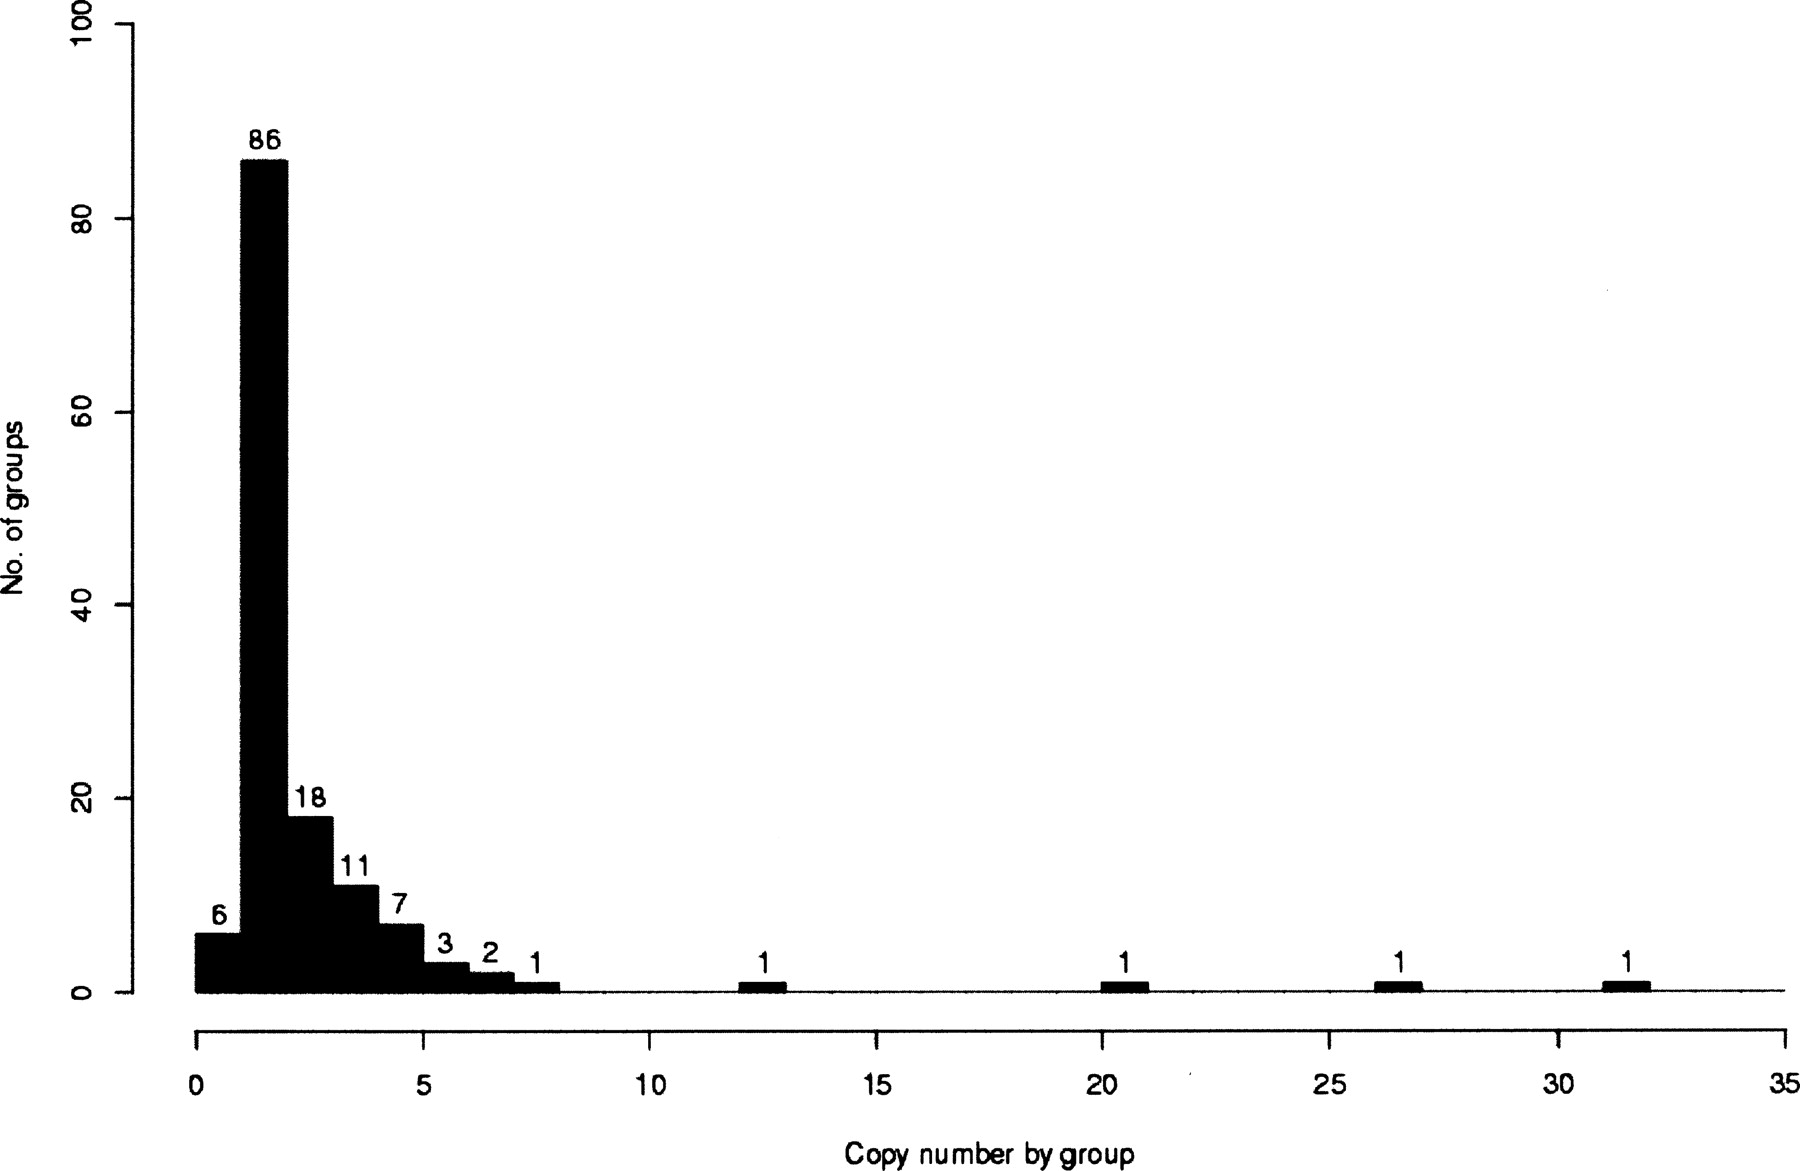
Figure 2.
Distribution of SD copy number. This plot illustrates the distribution of the copy number per group of repeated copies. Each group corresponds to a set of similar sequences (SDs). The number of groups is labeled for each black bar. The three single-copy number groups correspond to tandem repeats that were detected as one sequence in one group. Our strategy of duplication detection connects the repeat units that are very close and in tandem (see Methods).


