
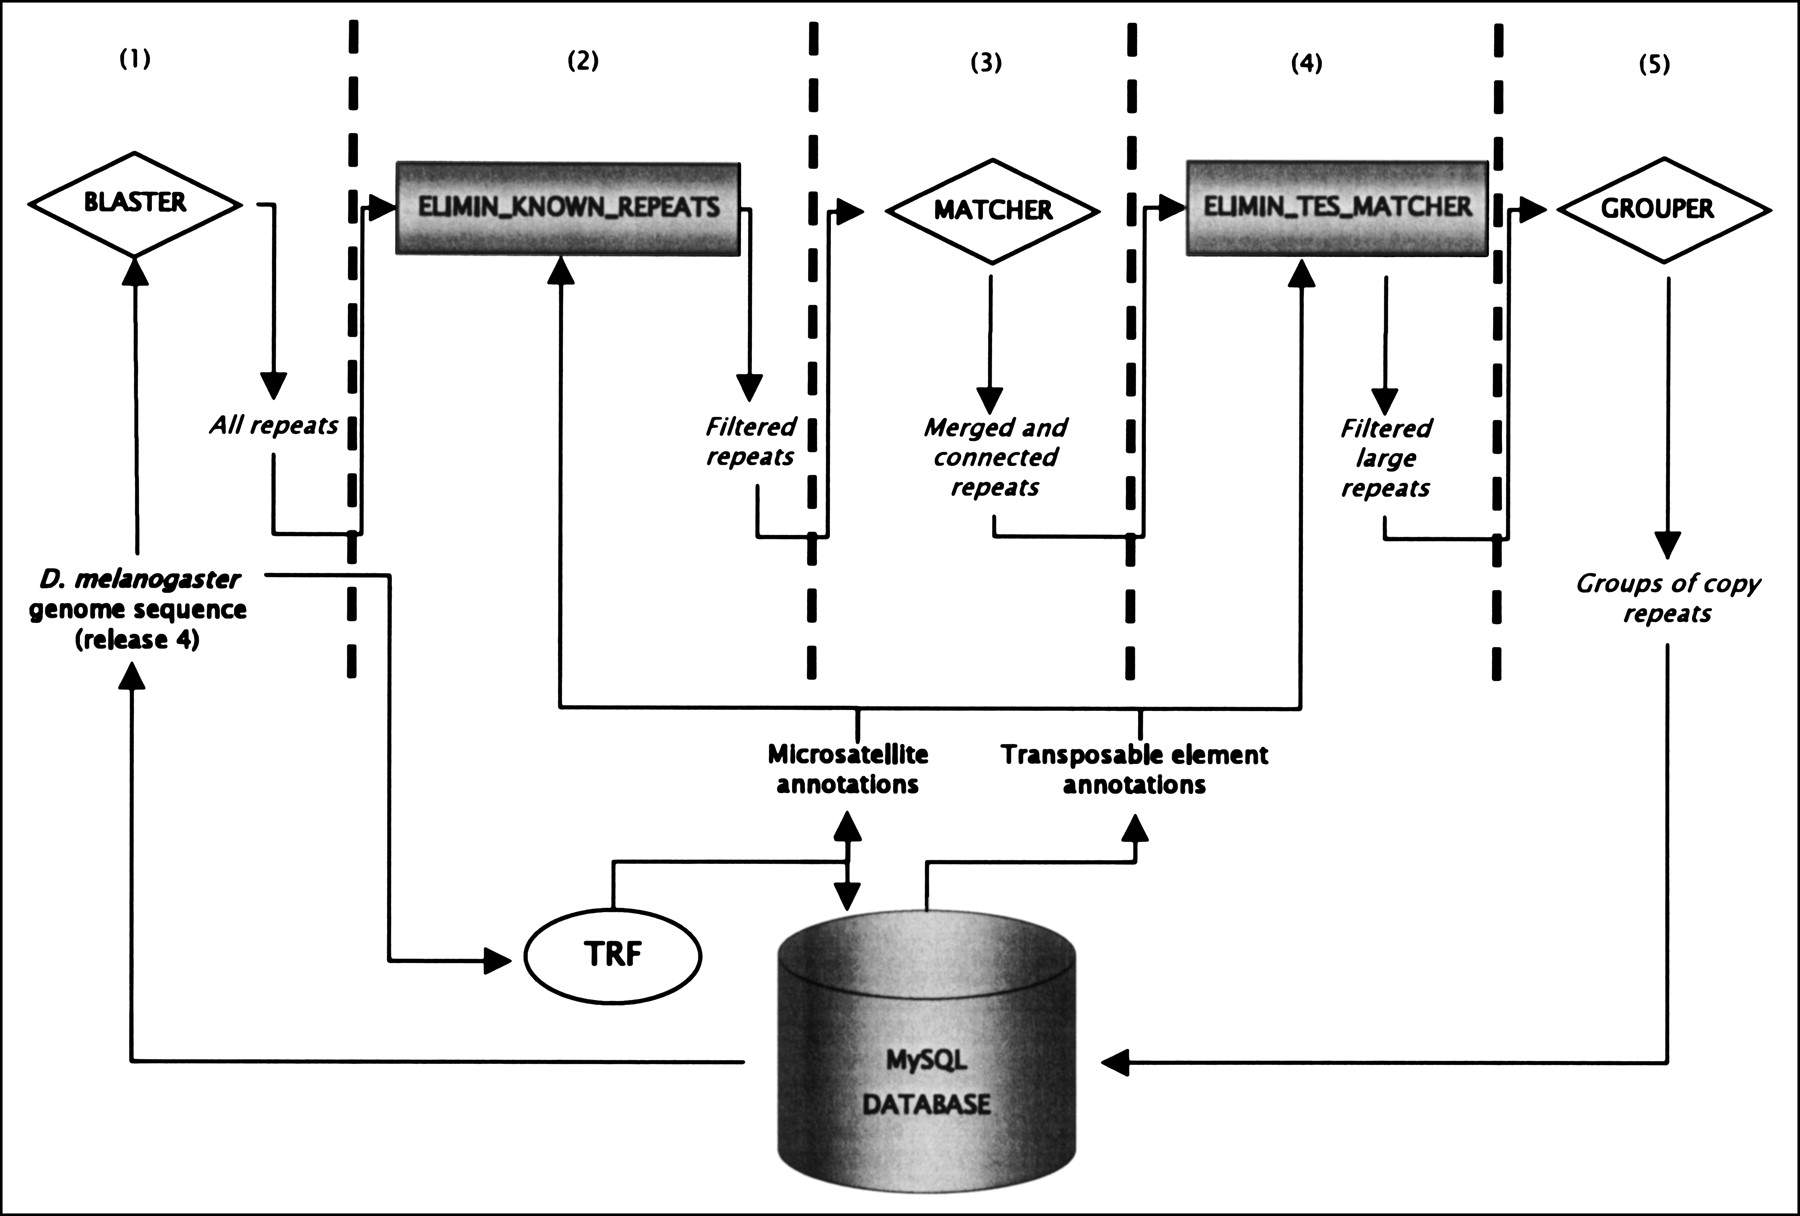
Figure 1.
Flowchart representation of the SD detection pipeline. This pipeline combines a series of published programs and new programs. Published programs are represented by diamonds and ovals. Newly implemented programs are illustrated by gray-shaded boxes. A MySQL database manages the annotations and results. (1) Detection of all repeats; (2) elimination of all repeats belonging to microsatellite or TE regions; (3) merge and connection of contiguous repeats; (4) elimination of potential false-positive SDs (i.e., TEs); (5) clustering of repeats sharing similar regions.


