
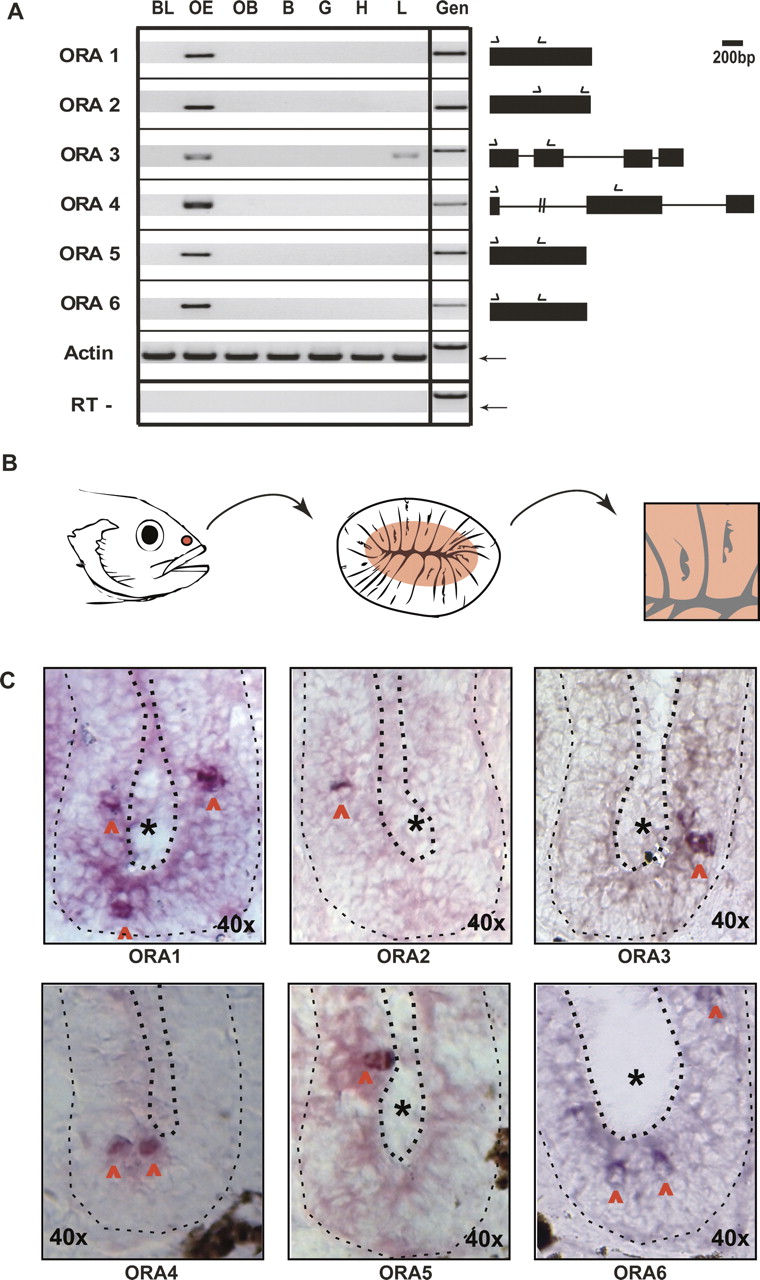
Expression of ora transcripts in the zebrafish olfactory system. (A) Expression of ora mRNA detected by RT-PCR. PCR amplifications were performed by using gene-specific primers (arrows above the gene structure scheme). BL, barbels + lips; OE, olfactory epithelium; OB, olfactory bulb; B, brain; G, gills; H, heart; L, liver; Gen, genomic DNA. Actin, both plus and minus RT, and genomic DNA as template for all oras and actin were used as controls. The single actin band as well as the absence of actin amplification products in the “minus RT” condition confirm the absence of genomic DNA contamination. That genomic DNA, if present, would have generated a visible amplification product is shown in the lane labeled “Gen.” Gel sections shown all correspond to the 400–900 bp range, with exception of the much larger genomic product of ora4. The weak band with ora3 in liver cDNA might be due to minor ectopic expression, as has been reported for several olfactory receptor genes (e.g., Vanderhaeghen et al. 1993). Arrows in the actin rows point to the expected position for the cDNA product. (B) Schematic representation of the localization of the OE followed by a drawing of a horizontal section of OE (lamellae are cut perpendicular to their flat face) and finally an enlargement of two lamellae. The central rose-colored area in the lamellae indicates the location of the sensory neuroepithelium (cf. Weth et al. 1996), gray lines, basal lamina, gray jagged spots, lumen. (C) In situ hybridizations with ora1, ora2, ora3, ora4, ora5, and ora6 in horizontal sections of the OE, with antisense RNA probes. The area shown corresponds roughly to one half of the schematical representation in the right panel of B. The black asterisks indicate the lumen. Each half-lamella is enclosed by dashed lines, thicker in the apical region and thinner in the basal region adjoining the basal lamina. Red arrowheads point to the labeled neurons.


