
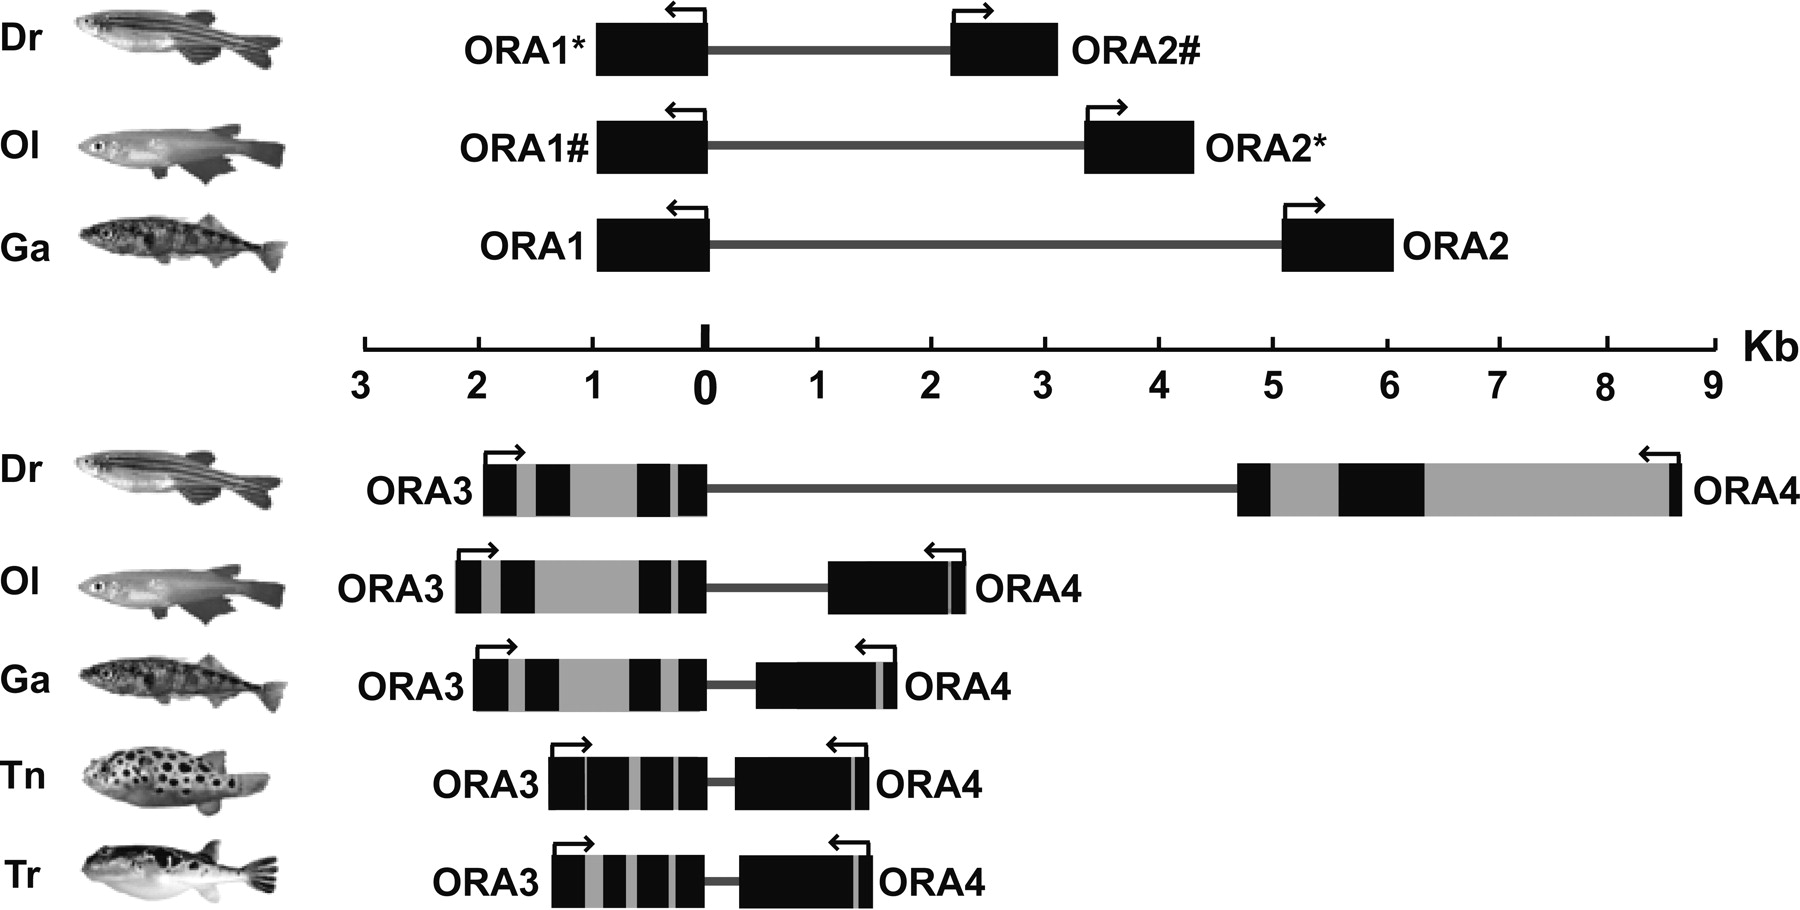
Figure 6.
Genomic arrangement of the ora1–ora2 and ora3–ora4 gene pairs. Exons are represented by the black filled rectangles, introns are represented by the gray filled rectangles, and the thick line represents the intergenic distance between the two members of a gene pair. All elements are drawn to scale.


