
Distribution of the novel N1 motif in the cartilage gene set
Click on table to view larger version.
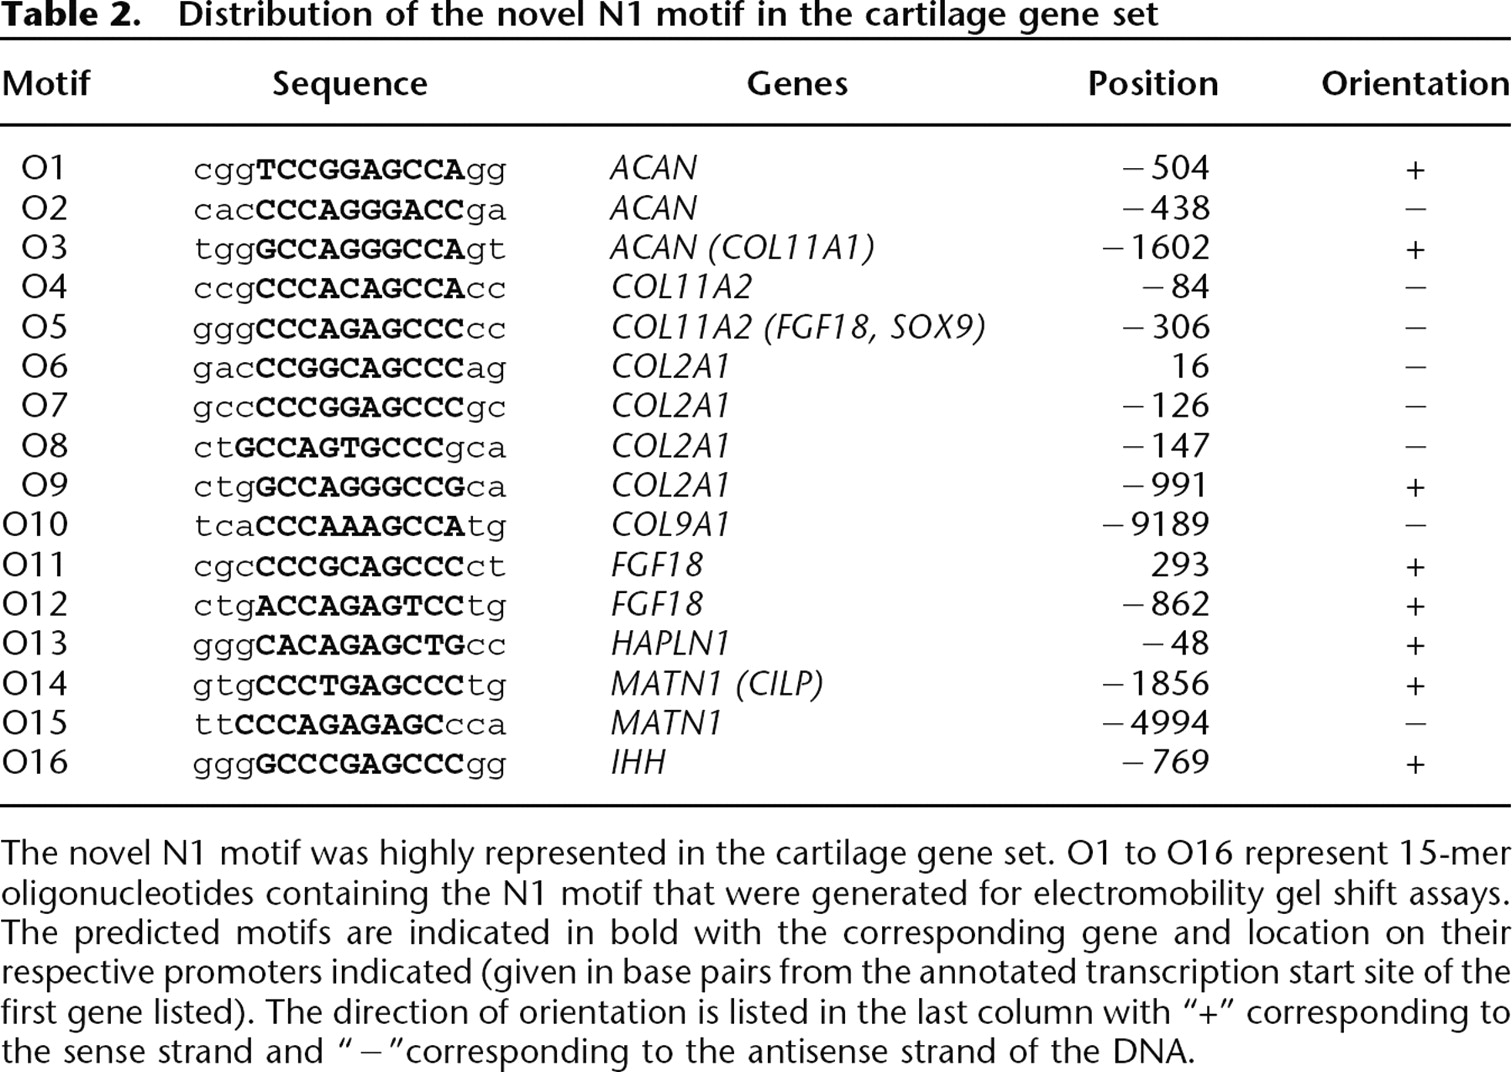
The novel N1 motif was highly represented in the cartilage gene set. O1 to O16 represent 15-mer oligonucleotides containing the N1 motif that were generated for electromobility gel shift assays. The predicted motifs are indicated in bold with the corresponding gene and location on their respective promoters indicated (given in base pairs from the annotated transcription start site of the first gene listed). The direction of orientation is listed in the last column with “+” corresponding to the sense strand and “−”corresponding to the antisense strand of the DNA.


