
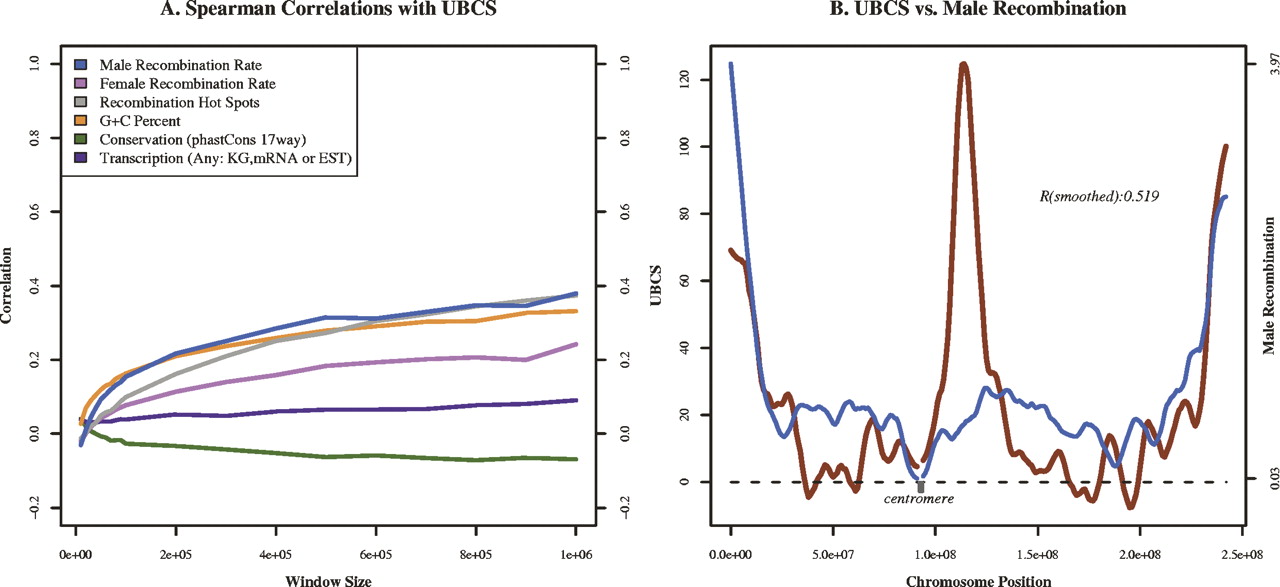
UBCS is strongly correlated with male recombination rates. (A) Spearman correlation between unsmoothed UBCS and different genomic variables for windows of size 10 kb to 1 Mb over the whole human genome. Male recombination rate (blue), recombination hot spots (gray), and G+C% (orange) have the highest correlations with UBCS. These correlations rise with increasing window size, particularly in the case of recombination hot spots. Female recombination rate (pink) is less highly correlated with UBCS. Transcription (purple) and conservation (green) are not significantly correlated with UBCS. (B) UBCS (red) and male recombination rate (blue) vary together along all the autosomes, with distal regions showing steep rises in both variables. Chromosome 2 (shown) has the weakest correlation, due mostly to the low male recombination rate in the zone of fusion.


