
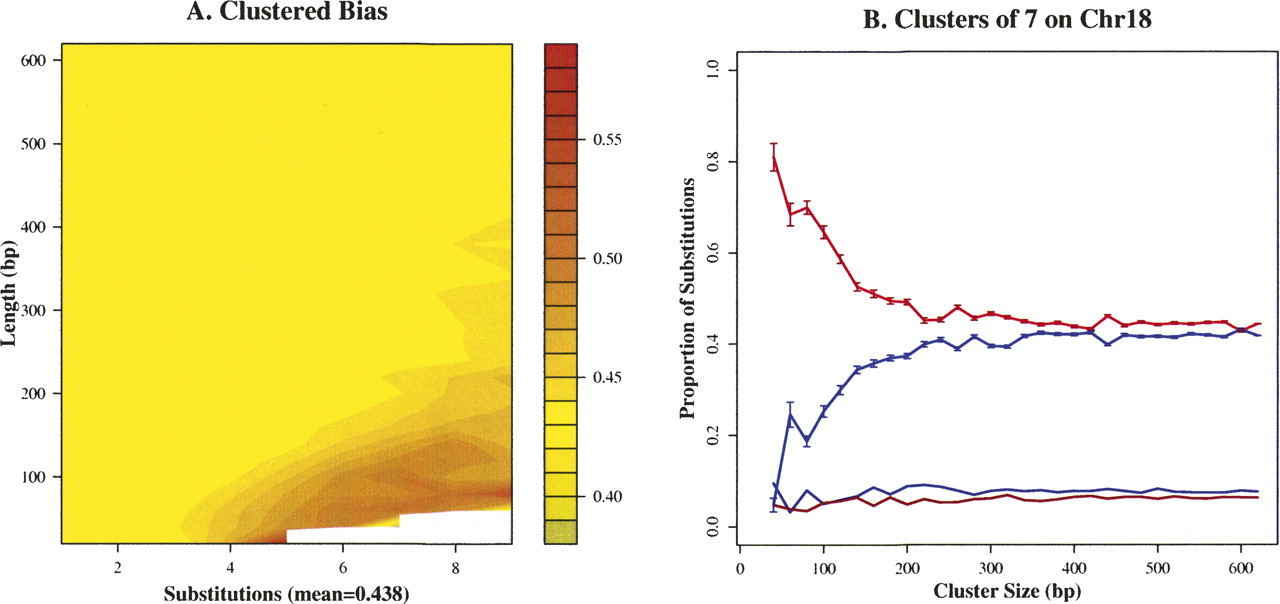
Clusters of substitutions are biased weak (AT) to strong (GC). (A) This heat map shows the proportion of substitutions that are weak-to-strong (color scale) as a function of the local substitution rate for a range of sizes and densities of substitutions. The overall proportion of substitutions that are weak-to-strong is 0.438 genome-wide (yellow). As substitution density approaches 4 or more within 100 bp, the proportion rises to 0.58 (red). (B) Chromosome 18 shows a particularly strong relationship between substitution density and bias, as can be seen for clusters of seven substitutions in the “zipper” plot. A similar pattern was observed on all autosomes. Additional graphics are available at http://www.soe.ucsc.edu/research/compbio/ubcs/.


