
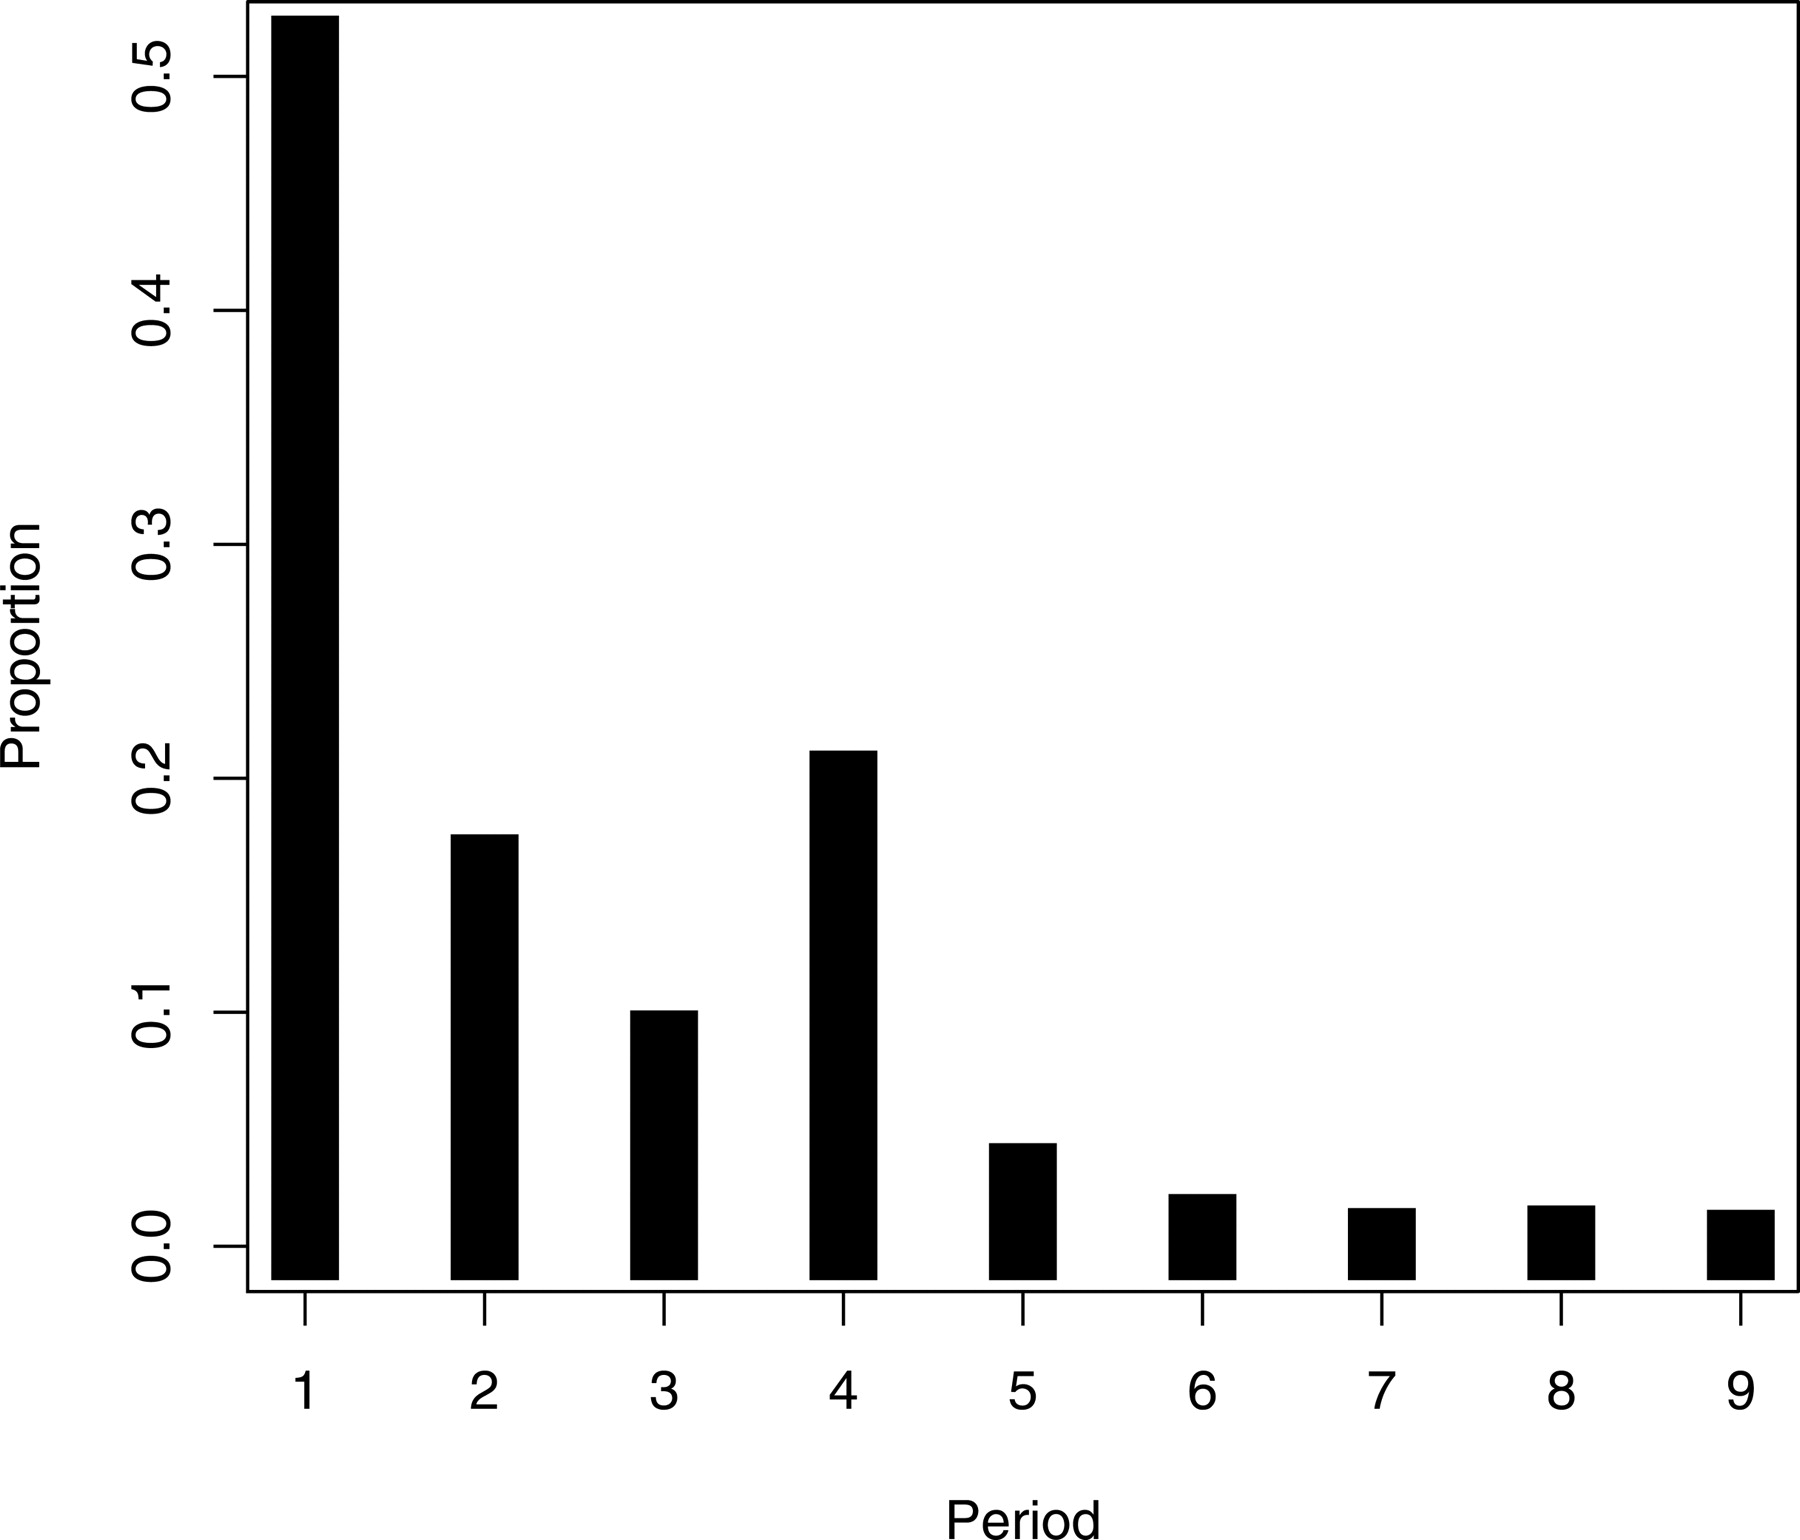
Figure 3.
Period distribution of periodic DNA. The histogram shows the number of times a pattern of period p has been observed.
(Downloading may take up to 30 seconds. If the slide opens in your browser, select File -> Save As to save it.)
Click on image to view larger version.
Period distribution of periodic DNA. The histogram shows the number of times a pattern of period p has been observed.
 CiteULike
 Delicious
 Digg
Digg Facebook
 Google+
 Reddit
 Twitter
