
Proteomics data coverage for functional categories
Click on table to view larger version.
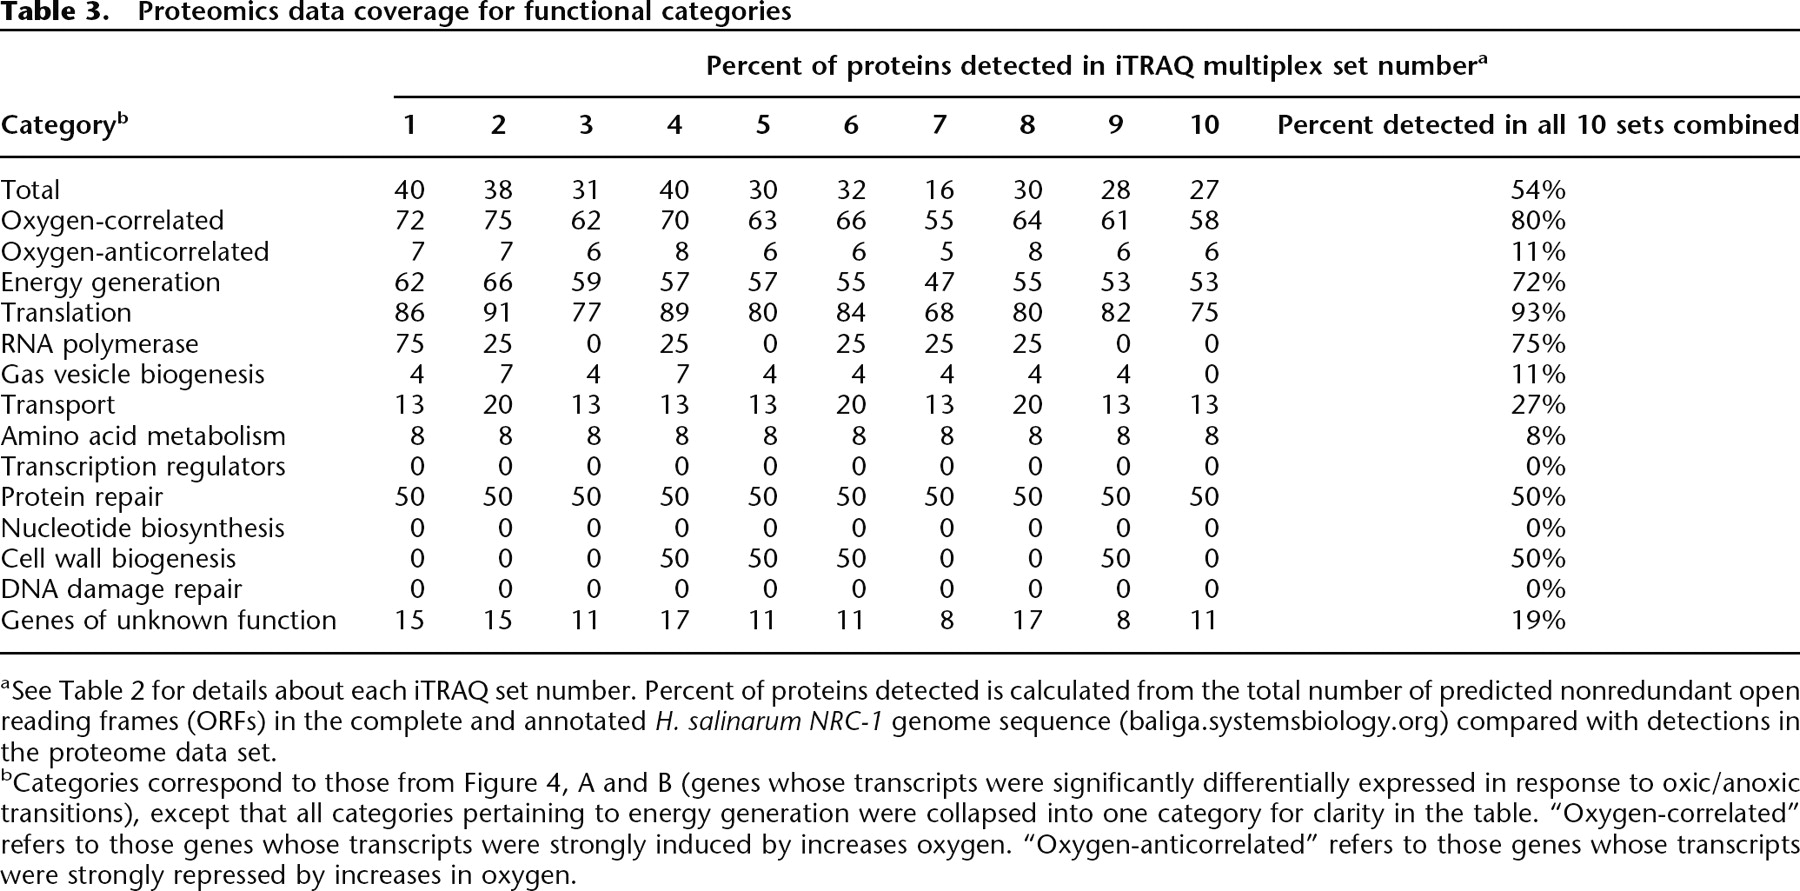
aSee Table 2 for details about each iTRAQ set number. Percent of proteins detected is calculated from the total number of predicted nonredundant open reading frames (ORFs) in the complete and annotated H. salinarum NRC-1 genome sequence (baliga.systemsbiology.org) compared with detections in the proteome data set.
bCategories correspond to those from Figure 4, A and B (genes whose transcripts were significantly differentially expressed in response to oxic/anoxic transitions), except that all categories pertaining to energy generation were collapsed into one category for clarity in the table. “Oxygen-correlated” refers to those genes whose transcripts were strongly induced by increases oxygen. “Oxygen-anticorrelated” refers to those genes whose transcripts were strongly repressed by increases in oxygen.


