
Physiological data for all three chemostat time course experiments
Click on table to view larger version.
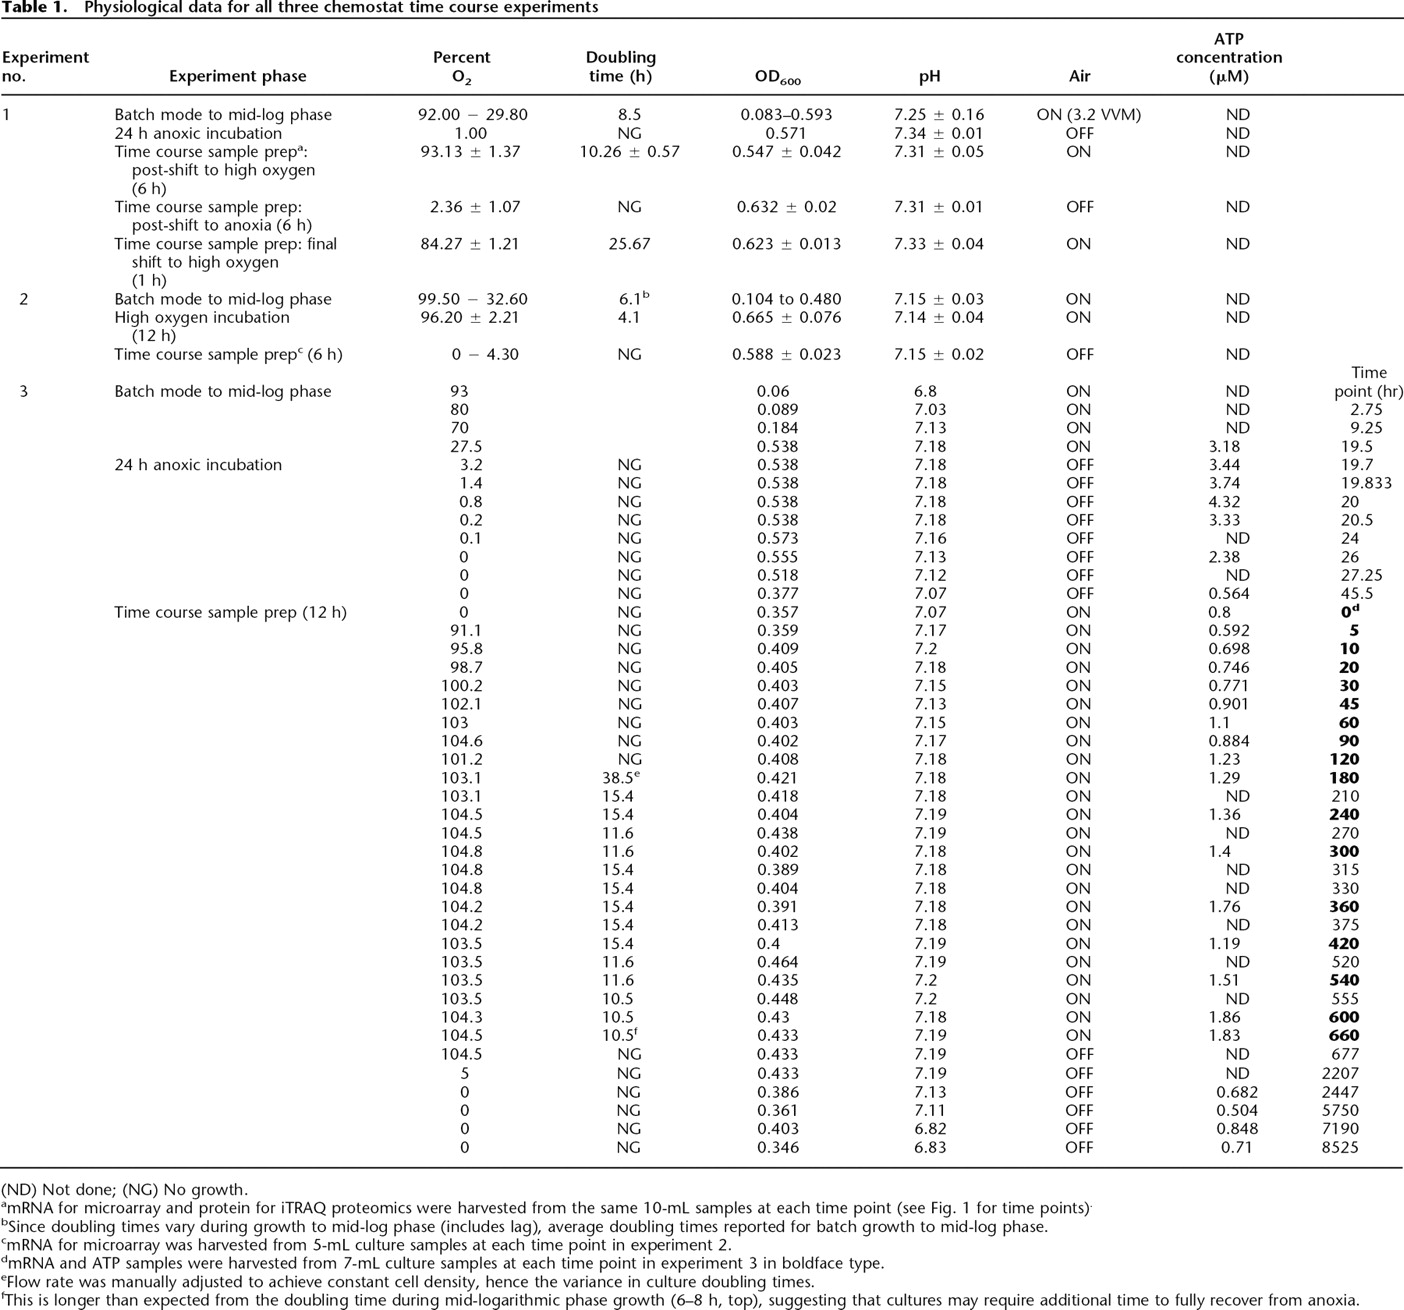
(ND) Not done; (NG) No growth.
amRNA for microarray and protein for iTRAQ proteomics were harvested from the same 10-mL samples at each time point (see Fig. 1 for time points).
bSince doubling times vary during growth to mid-log phase (includes lag), average doubling times reported for batch growth to mid-log phase.
cmRNA for microarray was harvested from 5-mL culture samples at each time point in experiment 2.
dmRNA and ATP samples were harvested from 7-mL culture samples at each time point in experiment 3 in boldface type.
eFlow rate was manually adjusted to achieve constant cell density, hence the variance in culture doubling times.
fThis is longer than expected from the doubling time during mid-logarithmic phase growth (6–8 h, top), suggesting that cultures may require additional time to fully recover from anoxia.


