
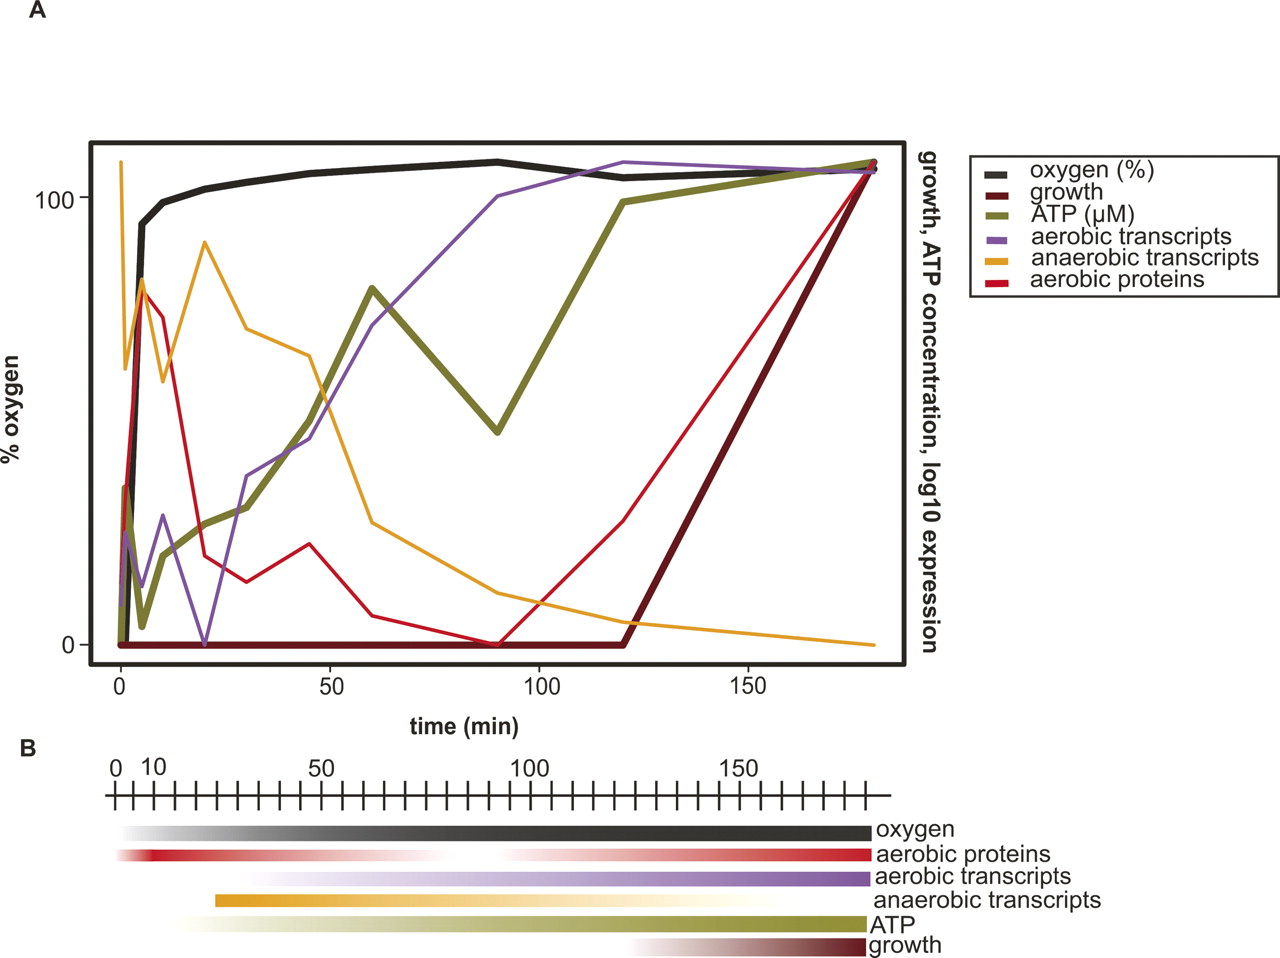
A comprehensive temporal model of molecular events occurring between incidence of oxygen and resumption of growth. (A) Data summary. Oxygen (black line) is plotted against time (X-axis) and overlaid with mean profiles for all 106 significantly oxygen-correlated transcripts (purple line), 109 oxygen-anticorrelated transcripts (orange line), ATP concentrations (green line), growth rate from chemostat experiments (brown line), and protein profiles for all 83 proteins that were detected for oxygen-correlated transcripts (red line). Each line in the graph was plotted on its own scaled Y-axis (data not shown) against time (X-axis) and superimposed on the others for clarity. (B) Dynamic temporal timeline model. Each parameter measured is shown in a colored box corresponding to its time of induction (more intense color) and repression (fading to white).


