
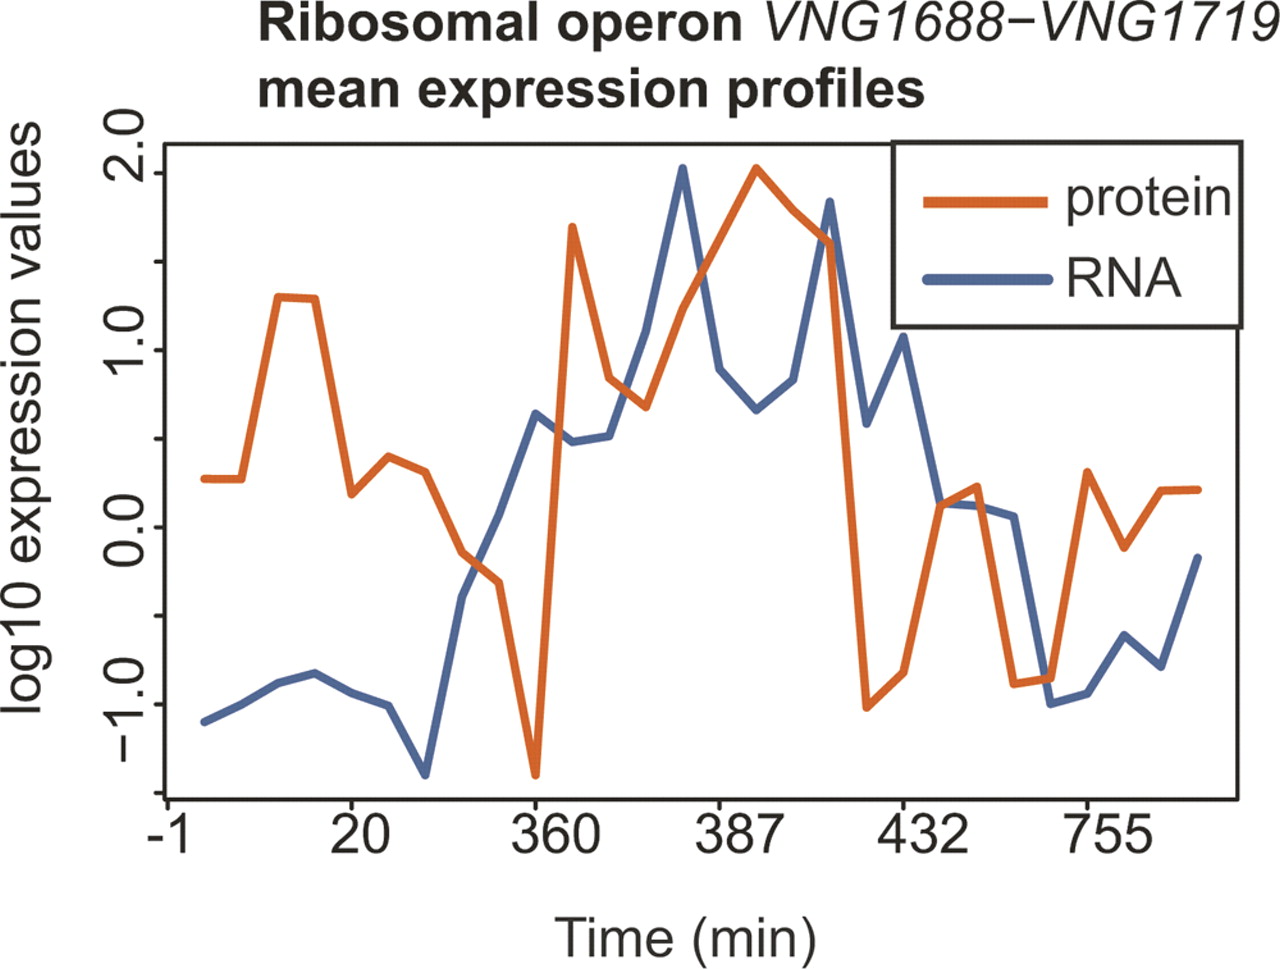
Figure 6.
An initial burst of translation for some operons is observed prior to induction of RNA expression after oxygen up-shift. Mean profiles are shown for all genes in the largest ribosomal operon, which contains 24 genes from VNG1688–VNG1719 (mean transcript profile in blue and mean protein profile in orange). The X-axis represents time post-shift to high oxygen in the first replicate chemostat experiment (see also Fig. 1 and Table 1).


