
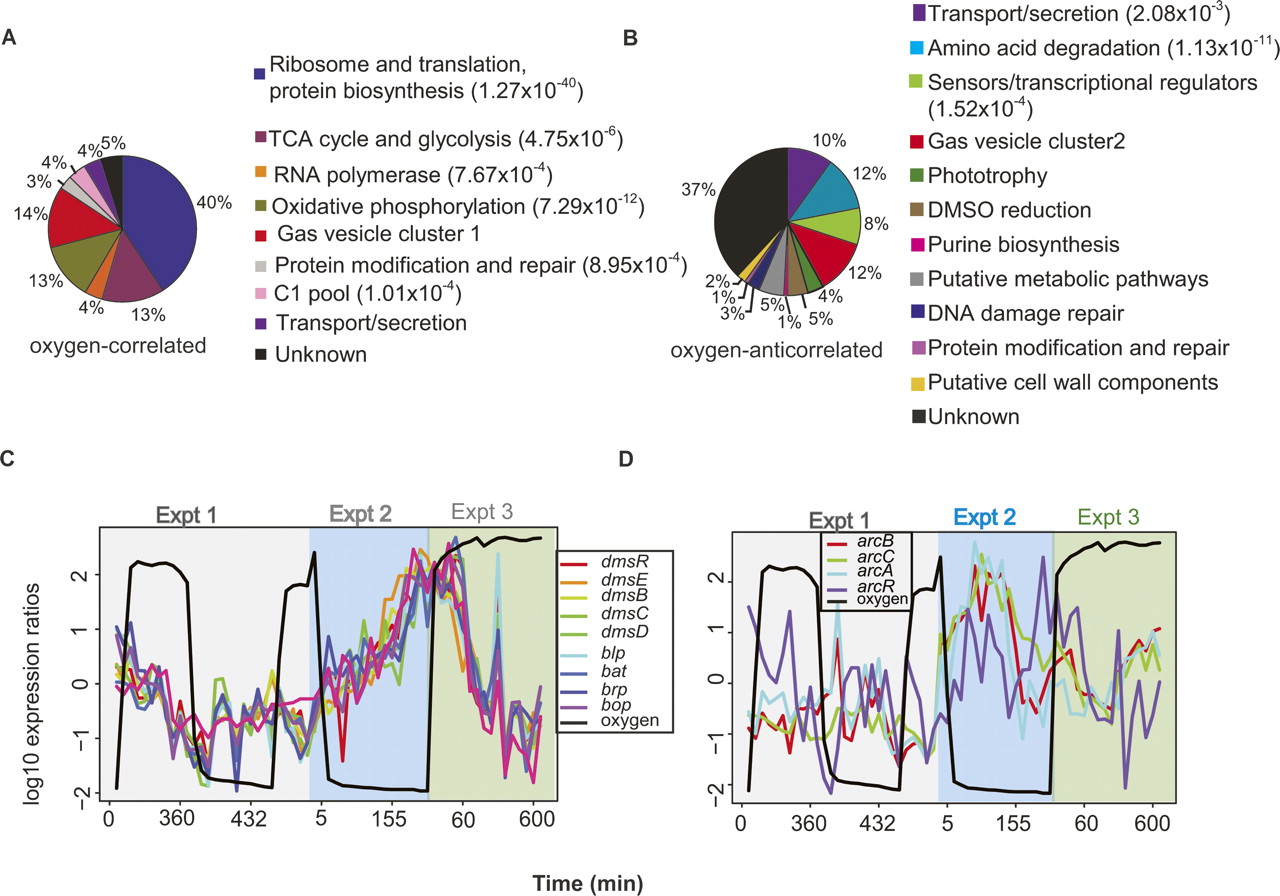
Functional categorization of genes significantly correlated or anticorrelated with oxygen. (A) Functional categories for oxygen-correlated genes. (B) Functional categories for oxygen-anticorrelated genes. Percentages for each slice of the pie chart refer to the fraction of genes from that category that make up the total 106 oxygen-correlated (A) or 109 oxygen-anticorrelated (B) genes. GO and KEGG functional over-representation P-values for these categories are shown in parentheses and Supplemental Tables 1 and 2. Those categories with no P-value were not present in the GO and KEGG database annotations (and are part of the 98 hand-curated annotations described in the Methods). (C) DMSO reduction and bacteriorhodopsin-mediated phototrophy genes are induced by anaerobiosis even in the absence of DMSO or light. Each gene in the pathways is shown, the color-coded profile for which is denoted in the legend. (D) Surprisingly, the arcRABC gene cluster, encoding proteins in the ADI pathway for anaerobic arginine fermentation, is not correlated with oxygen.


